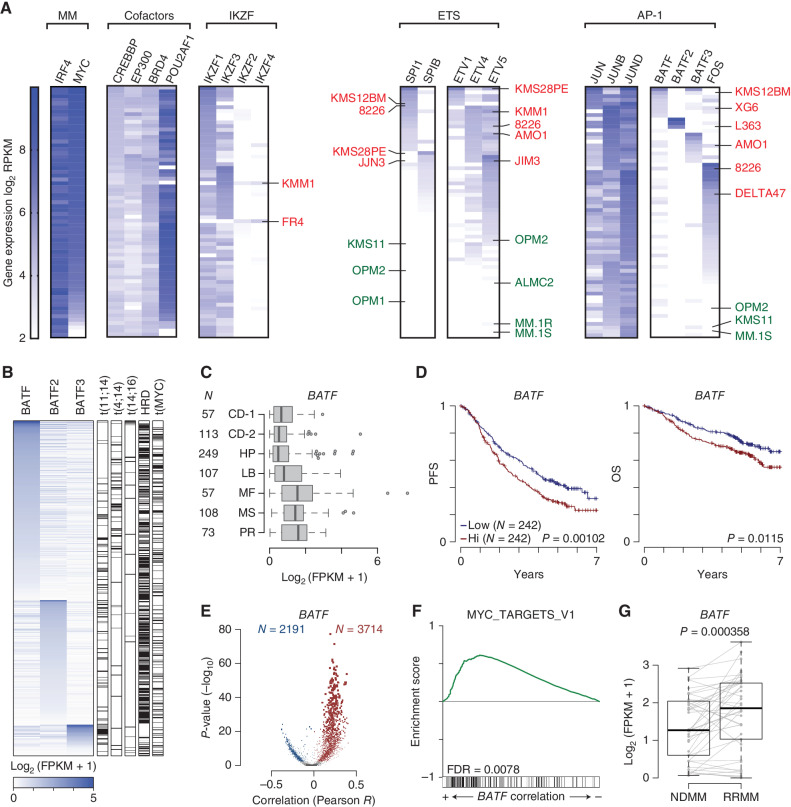
Figure 5.
Myeloma tumors have unique trans-factor expression plasticity that contributes to poor outcomes in patients. A, Gene-expression data for 66 HMCLs displayed as a heat map using log2 RPKM values (key on left). HMCLs were grouped functionally: MM (multiple myeloma factors, IRF4 and MYC); cofactors; IKZF (zinc finger proteins); ETS factors; and AP-1 factors). Once grouped, the cells were then ranked in seven different ways based on trans-factors of interest (listed diagonally above). Each black box has a unique rank order based on the gene-expression levels for the factors listed. A cell line can only occupy one row per black box. Select IMiD-resistant cell lines are denoted in red, and IMiD-sensitive cell lines in green. B, Expression of BATF, BATF2, and BATF3 in newly diagnosed (NDMM) CoMMpass samples with matching RNA-seq and whole-genome sequencing (N = 586). Primary IGH translocations, hyperdiploidy (HRD), and MYC translocations are annotated (right). C, Box plot of BATF expression in NDMM samples from the CoMMpass study categorized by gene-expression subtype for samples with RNA-seq (N = 764). The number of samples (N) in each subtype is denoted (left); subtypes are from Zhan et al. (55). CD-1, Cyclin D1; CD-2, Cyclin D1 and CD20; HP, hyperdiploid; LB, low bone disease; MF, MAF; MS, MMSET; PR, proliferation. D, Progression-free survival (PFS; left) and overall survival (OS; right) Kaplan–Meier curves of CoMMpass NDMM patients with RNA-seq and outcome data and treated with first-line IMiD-containing therapies (N = 484) stratified by median BATF expression. P values were determined by a Wald test of a Cox-proportional hazard regression treating BATF expression as a quantitative response. E, Volcano plots of gene expression correlated with BATF. The Pearson correlation coefficient of each gene with BATF is shown on the x axis, and the significance −log10(P value) is shown on the y axis. Genes significantly (FDR ≤0.01) correlated with BATF are shown in color (red, positive; blue, negative) with the number of significant genes listed (N). F, GSEA of gene expression correlated with BATF in a cross-sectional analysis of CoMMpass NDMM samples. The enrichment score is shown (top) with overlap with GSEA hallmark gene sets shown on the bottom. G,BATF expression in paired NDMM and relapse refractory (RRMM) samples from 35 CoMMpass patients with matching samples treated with IMiD-containing first-line therapies. P value was determined with a linear regression using a covariate for the patient.

