. 2023 Sep 27;5(1):34–55. doi: 10.1158/2643-3230.BCD-23-0062

Figure 6.

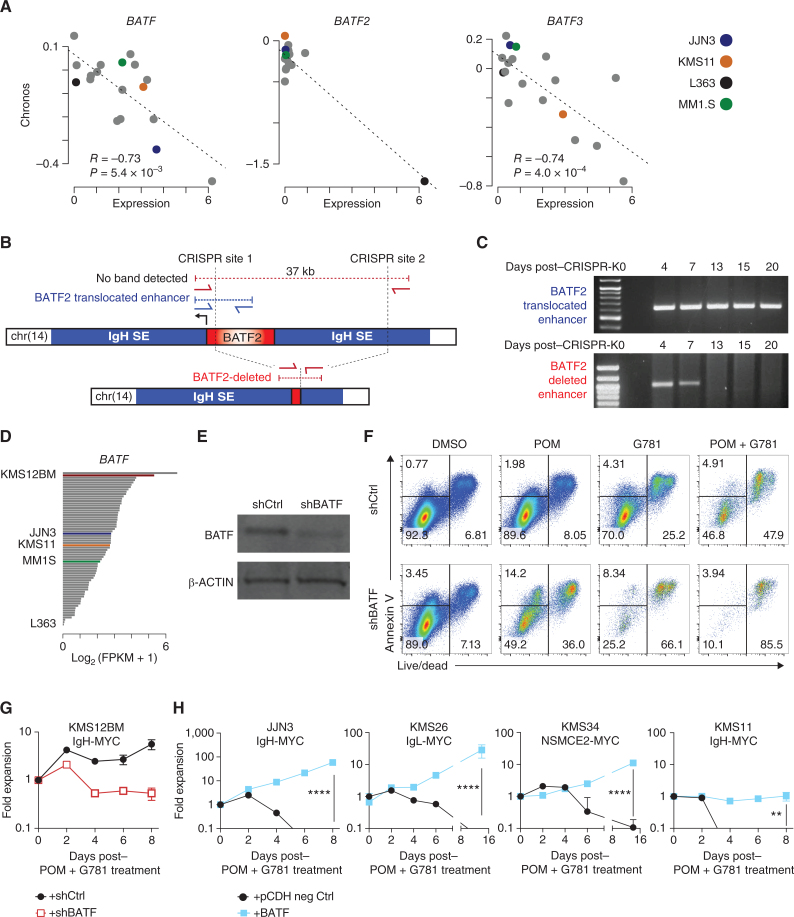
Figure 6. BATF proteins promote myeloma viability and drug resistance. A, Scatter plot of expression (x axis) by dependency (Chronos, y axis) for BATF (left), BATF2 (middle), and BATF3 in multiple myeloma cell lines in the DepMap project. Expression data from the Cancer Cell Line Encyclopedia. Pearson correlation (R) and significance of correlation (P) as determined by linear regression are listed. Select cell lines are denoted in color (key, right). B, Diagram of the BATF2 translocation in L363 cells identified by mate-pair sequencing (top), CRISPR-Cas9 targeting sites (vertical dotted lines), and the PCR primers (red and blue arrows) used to distinguish the endogenous translocated region from the successfully deleted BATF2/enhancer region (bottom). C, PCR analysis of genomic DNA from L363 cells electroporated with CRISPR-Cas9 and sgRNAs targeting the BATF2/Enhancer locus (B). The top gel shows the detection of the translocated BATF2/enhancer across all days tested. Bottom panel shows successful deletion of BATF2/enhancer that is lost following 7 days of coculture expansion. D, BATF expression in a panel of 66 HMCLs determined by RNA-seq. Expression is shown in fragments per kilobase per million reads (FPKM) with select cell lines labeled and shown in color. E, Western blot of BATF and β-ACTIN loading control in shRNA knockdown of BATF (shBATF) or a negative control (shCtrl) of BATF in KMS12BM cells. F, Representative flow cytometry plots of KMS12BM cells infected with shRNA empty vector (top) or an shRNA targeting BATF (bottom). Cells were plated at equal densities on day 0, then treated for 3 days with DMSO control, 200 nmol/L POM, 40 nmol/L G781, or the combination. Annexin V is shown on the y axis, Live/Dead viability dye is on the x axis. Equal volumes were analyzed for all conditions and biological triplicates were measured. The percent population of each gate is listed. G, Growth curve of panel F KMS12BM cells infected with shRNA empty vector (black line) or an shRNA targeting BATF (red line) and then treated with combination 200 nmol/L POM plus 40 nmol/L G781. Fold expansion is shown on the y axis (log10 scale). Days posttreatment are shown on the x axis. H, Growth curves of 4 different HMCLs expressing negative (neg) ctrl eGFP (black lines) or exogenous BATF (blue lines) and treated with combination 200 nmol/L POM plus 40 nmol/L G781. Fold expansion is shown on the y axis (log10 scale). Cell line and translocated enhancer driving MYC expression are shown on top. Days posttreatment are shown on the x axis. P values determined by an unpaired t test.

BATF proteins promote myeloma viability and drug resistance. A, Scatter plot of expression (x axis) by dependency (Chronos, y axis) for BATF (left), BATF2 (middle), and BATF3 in multiple myeloma cell lines in the DepMap project. Expression data from the Cancer Cell Line Encyclopedia. Pearson correlation (R) and significance of correlation (P) as determined by linear regression are listed. Select cell lines are denoted in color (key, right). B, Diagram of the BATF2 translocation in L363 cells identified by mate-pair sequencing (top), CRISPR-Cas9 targeting sites (vertical dotted lines), and the PCR primers (red and blue arrows) used to distinguish the endogenous translocated region from the successfully deleted BATF2/enhancer region (bottom). C, PCR analysis of genomic DNA from L363 cells electroporated with CRISPR-Cas9 and sgRNAs targeting the BATF2/Enhancer locus (B). The top gel shows the detection of the translocated BATF2/enhancer across all days tested. Bottom panel shows successful deletion of BATF2/enhancer that is lost following 7 days of coculture expansion. D,BATF expression in a panel of 66 HMCLs determined by RNA-seq. Expression is shown in fragments per kilobase per million reads (FPKM) with select cell lines labeled and shown in color. E, Western blot of BATF and β-ACTIN loading control in shRNA knockdown of BATF (shBATF) or a negative control (shCtrl) of BATF in KMS12BM cells. F, Representative flow cytometry plots of KMS12BM cells infected with shRNA empty vector (top) or an shRNA targeting BATF (bottom). Cells were plated at equal densities on day 0, then treated for 3 days with DMSO control, 200 nmol/L POM, 40 nmol/L G781, or the combination. Annexin V is shown on the y axis, Live/Dead viability dye is on the x axis. Equal volumes were analyzed for all conditions and biological triplicates were measured. The percent population of each gate is listed. G, Growth curve of panel F KMS12BM cells infected with shRNA empty vector (black line) or an shRNA targeting BATF (red line) and then treated with combination 200 nmol/L POM plus 40 nmol/L G781. Fold expansion is shown on the y axis (log10 scale). Days posttreatment are shown on the x axis. H, Growth curves of 4 different HMCLs expressing negative (neg) ctrl eGFP (black lines) or exogenous BATF (blue lines) and treated with combination 200 nmol/L POM plus 40 nmol/L G781. Fold expansion is shown on the y axis (log10 scale). Cell line and translocated enhancer driving MYC expression are shown on top. Days posttreatment are shown on the x axis. P values determined by an unpaired t test.