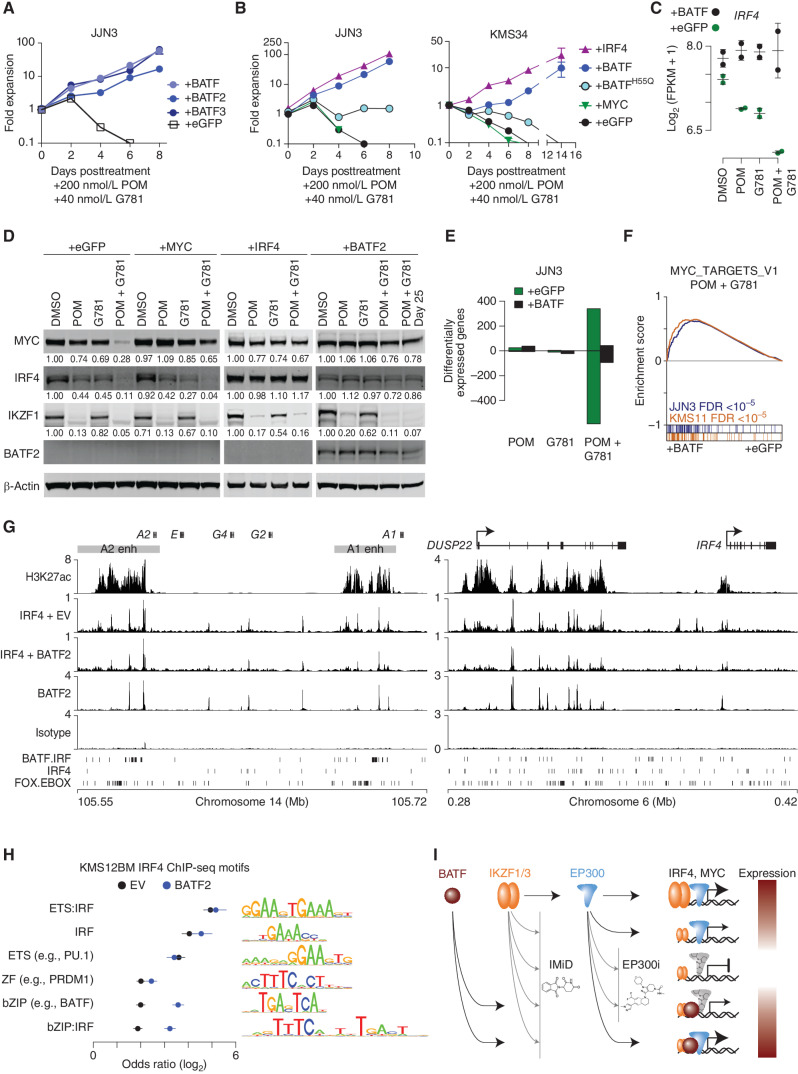
Figure 7.
BATF maintains IRF4 and MYC expression by regulating myeloma super-enhancers. A, Growth curves showing JJN3 cells expressing eGFP, BATF, BATF2, or BATF3 constructs listed and treated with 200 nmol/L POM plus 40 nmol/L G781. The y axis shows fold expansion relative to day 0 (log10). The x axis shows days posttreatment. B, Growth curves showing JJN3 and KMS34 cells expressing various constructs listed, and treated with 200 nmol/L POM plus 40 nmol/L G781. The y axis shows fold expansion relative to day 0 (log10). The x axis shows days posttreatment. C,IRF4 expression in JJN3 cells treated with 200 nmol/L POM, 40 nmol/L G781, or both (Combo) relative to DMSO controls in cells transduced with a control (eGFP) or BATF-overexpressing construct. D, Day 3 Western blot analysis showing MYC, IRF4, IKZF1, and BATF2 levels in JJN3 cells expressing various constructs (listed at the top), and treated with 200 nmol/L POM, 40 nmol/L G781, or the combination. Actin is shown as a loading control. E, Bar plot of the number of differentially expressed genes (FDR ≤0.01) in JJN3 cells treated with 200 nmol/L POM, 40 nmol/L G781, or both (Combo) relative to DMSO controls in cells transduced with a control (eGFP) or BATF-overexpressing construct. F, GSEA for BATF overexpression (+BATF, left) as compared with control (+eGFP, right) in JJN3 (blue) and KMS11 (orange) cells treated with POM and G781. The positive enrichment score (top) denotes enrichment of the GSEA Hallmark MYC_TARGETS_V1 genes in the BATF versus control. Genes for each cell are ranked and overlap with MYC_TARGETS_V1 genes are shown in color (bottom). G, H3K27Ac and IRF4 ChIP-seq in KMS12BM empty vector (EV) cells as well as IRF4 and BATF2 ChIP-seq in KMS12BM cells overexpressing BATF2 (+BATF2) at the IGH 3′ enhancers (left) and the DUSP22/IRF4 enhancer (right). Isotype control is shown, and BATF-IRF4 composite, IRF4, and FOX-EBOX motifs are shown at the bottom. H, Motif analysis of IRF4-bound regions for KMS12BM “+BATF2” and “EV” cells where the union of the top 5 enriched motifs for each condition was combined, and the odds ratio of each motif is plotted relative to shuffled background regions. Motif logos are shown (right). I, Model of MYC and IRF4 regulation by IKZF1/3, EP300, and BATF in the context of IMiDs and EP300 inhibitors (EP300i). IKZF1/3 and EP300 are found at enhancers of IRF4 and MYC (top row). IMIDs and P300i result in IKZF1/3 depletion and inhibition of P300, respectively, resulting in repression of IRF4 and MYC (rows 2-3) that can be overcome through ectopic expression of BATF, which also binds IRF4 and MYC enhancers. Expression level of IRF4 and MYC is denoted by color (red, high; white, low).

