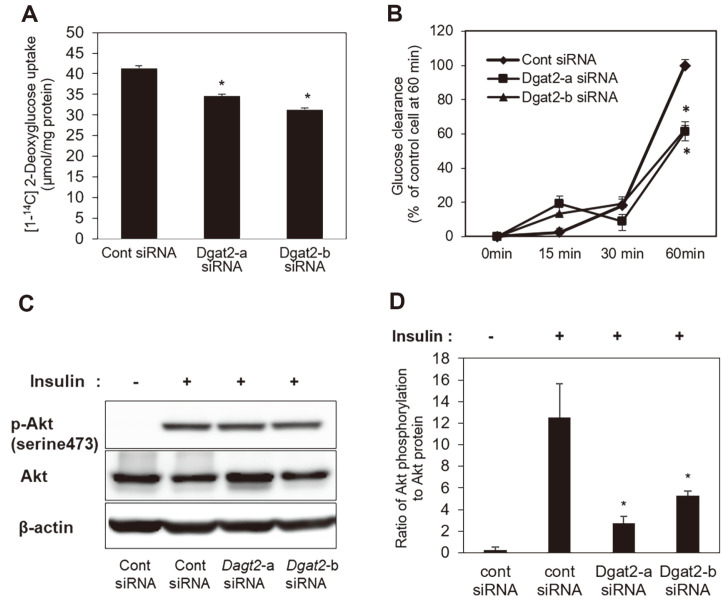
Fig. 3. Glucose uptake in skeletal myotubes under Dgat2 knockdown.
Three days after the initiation of differentiation, cells were transfected with control, Dgat2-a, or Dgat2-b siRNA. At 52 h after the transfection of the Dgat2 siRNA, the cells were fasted for 4 h, and (A) the cells were labeled with [1-14C]-2-deoxyglucose for 1 h in the presence of insulin (10 nM). Then, the [1-14C]-2-deoxyglucose uptake was measured. To investigate glucose in the remaining media, cells were treated with 10 nM insulin and 10 nM dexamethasone 52 h after transfection. (B) The medium was harvested at the indicated time points (0, 15, 30, and 60 min), and the remaining glucose was quantified. At 52 h after the transfection of either Dgat2-a or Dgat2-b siRNAs, (C) phosphorylation of Akt in cells transfected with control or Dgat2 siRNA was measured and (D) the induction of Akt phosphorylation in response to insulin was calculated by the relative density of the protein band to the nonphosphorylated form. The data are expressed as the means ± SEM. * p < 0.05, compared with control siRNAs.

