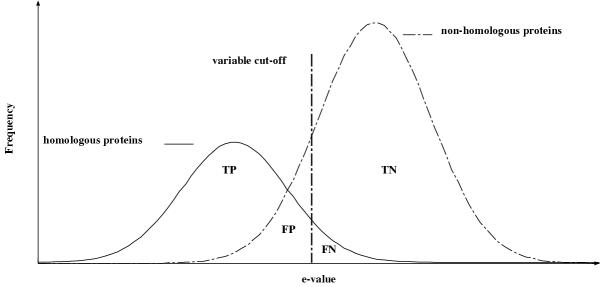
Figure 1.
A graphical representation of two different distributions of a homology search. The first distribution represents homologous sequences found by the search; while the second distribution represents the non-homologous hits produced by the search. Depending on the cut-off value used, a part of the distribution is called true positives (TP) as they were predicted by the search to be homologous and are homologous; while a small part of the real homologous proteins is predicted to be non-homologous proteins. This part of the distribution is called false negatives (FN). The second distribution is split as well into two parts: the first part being the so-called false positives (FP), non-homologous proteins being predicted to be homologous. The second part of this distribution are non-homologous proteins predicted to be non-homologous. This part is called true negatives (TN). The cut-off value is indicated by a vertical line. It is clear that for any cut-off value, false positives will be included in a prediction.

