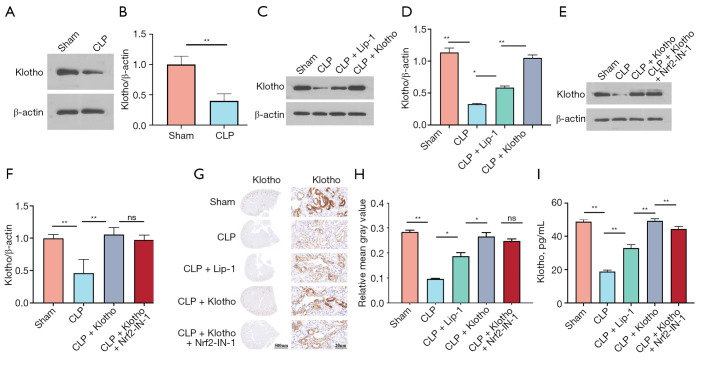
Figure 5.
Klotho treatment increases the levels of Klotho in kidney tissue. (A) Representative bands and (B) quantification of Klotho in mouse kidneys in the sham and CLP groups. n=3. β-actin was used as an internal control. (C) Representative bands and (D) quantification of Klotho in mouse kidneys among the four groups (sham, CLP, CLP + Lip-1, and CLP + Klotho groups). n=3. (E) Representative bands and (F) quantification of Klotho among the four groups (sham, CLP, CLP + Klotho, and CLP + Klotho + Nrf2-IN-1 groups). n=3. β-actin was used as an internal control. (G) IHC staining and (H) quantification of Klotho. n=3. (I) Levels of Klotho in serum. n=6. The results are expressed as the means ± standard deviation. *, P<0.05; **, P<0.01. Klotho, recombinant human Klotho protein; CLP, cecal ligation and puncture; Lip-1, liprostatin-1; Nrf2, nuclear factor erythroid-2 related factor 2; IHC, immunohistochemical; ns, no significance.

