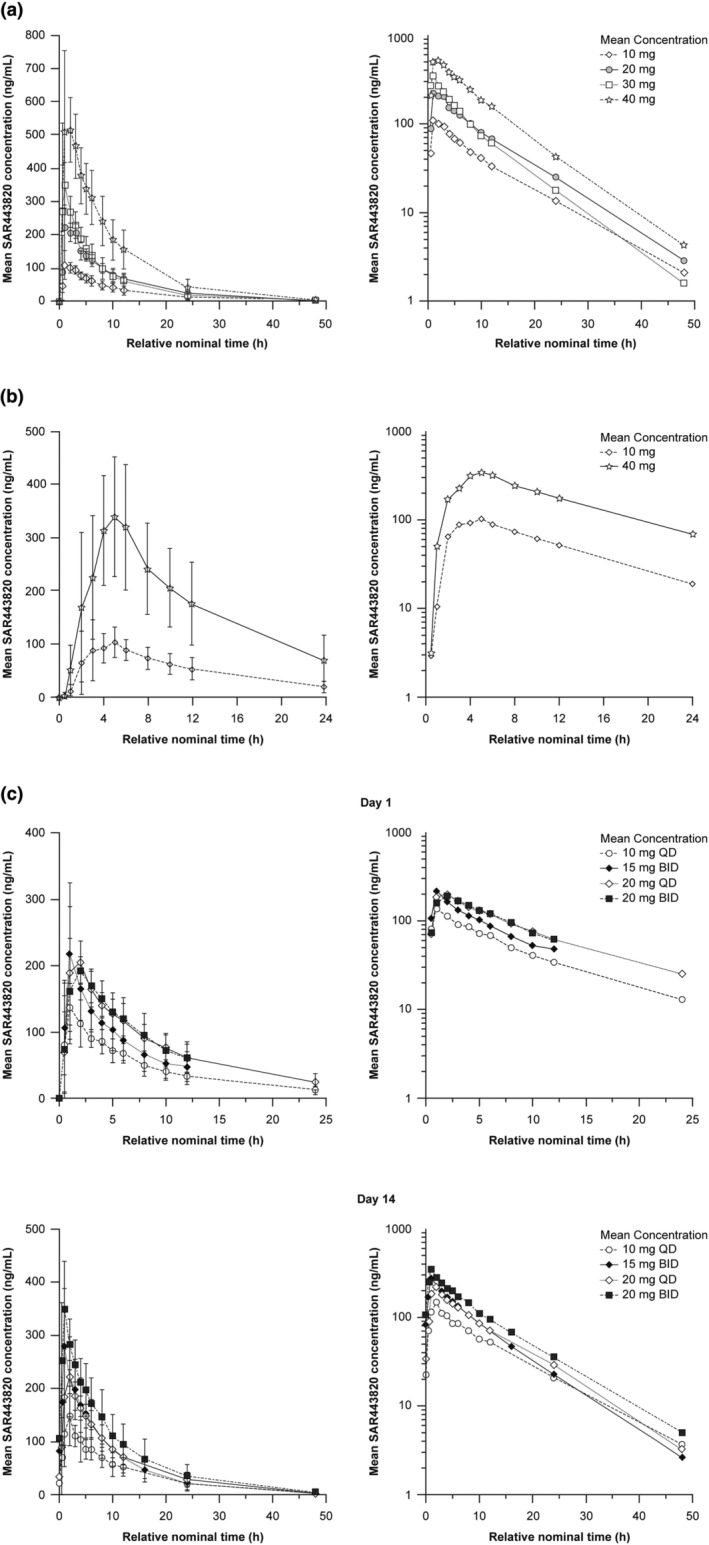
FIGURE 2.

Mean plasma concentration‐time profiles of SAR443820 in healthy participants – Pharmacokinetic population (a) SAD – part 1a, (b) PK‐CSF – part 1b, and (c) MAD – part 2 (day 1 and day 14). The error bars depict the standard deviations. Left panel represents linear scale and right panel represents semilogarithmic scale. BID, twice daily; CSF, cerebrospinal fluid; MAD, multiple ascending dose; QD, once daily; PK, pharmacokinetic; SAD, single ascending dose.
