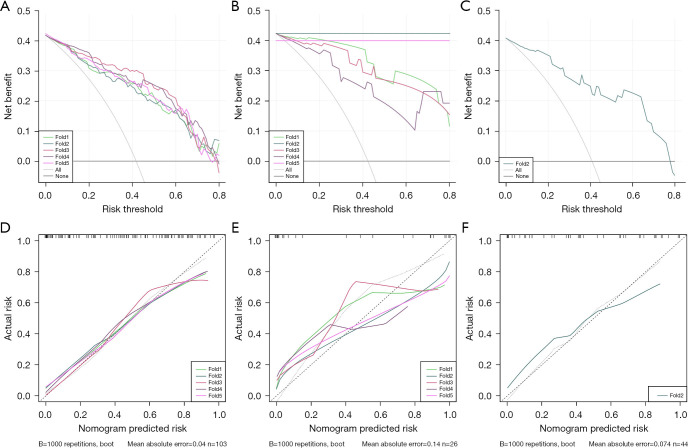
Figure 6.
DCA and calibration curve of the models. DCA of the training set (A), validation set (B), and test set (C). The cross axis and vertical axis represent the threshold probability value and the net benefit, respectively. Calibration curve for the training (D), validation (E), and test set (F). The calibration curve was used to assess the accuracy of the model. The calibration curve is closer to the diagonal indicated the model is closer to the actual value. DCA, decision curve analysis.

