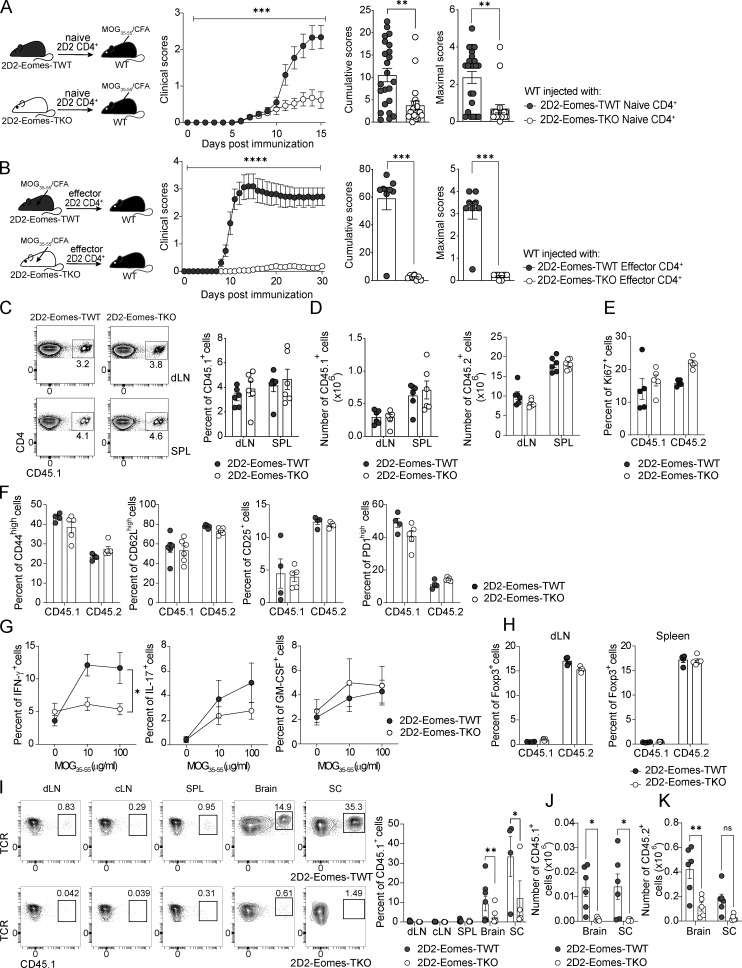
Figure 1.
Eomes is required for pathogenic CD4+ T cells functions during neuroinflammation. (A) 200,000 naïve CD4+ T cells from 2D2-Eomes-TWT or 2D2-Eomes-TKO mice were injected into WT C57BL/6J recipient mice prior to immunization (n = 23 and 20 mice per group, respectively) and clinical scores were evaluated and cumulative and maximal scores were determined. (B) 2D2-Eomes-TWT and 2D2-Eomes-TKO mice were immunized with MOG35–55 peptide emulsified in CFA. At 7 dpi, cells from dLN and spleen were collected and stimulated with MOG35–55 in the presence of anti-IFN-γ mAb and IL-23. CD4+ T cells were then purified, and 800,000 cells were injected i.v. into C57BL/6J recipients (n = 8 mice per group). Clinical scores were then evaluated, and cumulative and maximal scores were determined. (C) Naïve CD45.1+ cells purified from 2D2-Eomes-TWT or 2D2-Eomes-TKO mice were injected into WT C57BL/6J CD45.2 recipient mice (n = 4–6 mice per group) prior to immunization with MOG35–55 peptide and percentage of CD45.1+ cells among CD4+ T cells was assessed in both dLN and spleen (SPL) at 8 dpi. (D) Absolute numbers of 2D2 cells (CD45.1) and endogenous CD4+ T cells (CD45.2) were assessed in both dLN and spleen at 8 dpi (n = 6 mice/group). (E and F) (E) Ki67 and (F) activation marker expression were analyzed in both CD45.1+ and CD45.2+ CD4+ T cells from mice injected with either 2D2-Eomes-TWT and 2D2-Eomes-TKO cells at 8 dpi (n = 4 or 5 and 5 mice, respectively). (G) Intracellular staining of IFN-γ, IL-17, and GM-CSF expression by 2D2-Eomes-TWT and 2D2-Eomes-TKO CD45.1+ T cells from the dLN was assessed at 8 dpi after 48 h of ex vivo restimulation with MOG35–55 peptide (n = 10 and 9 mice/group). (H) Percentage of Foxp3+ CD4+ T cells was assessed in both CD45.1+ and CD45.2+ compartments in dLN and spleen at 8 dpi (n = 4 and 5 mice). (I) Naïve CD4+ T cells from 2D2-Eomes-TWT and 2D2-Eomes-TKO mice were injected into C57BL/6 mice prior to immunization (n = 6 mice/group), and percentages of CD45.1+ 2D2-Eomes-TWT or 2D2-Eomes-TKO cells were analyzed at 14 dpi in dLN, cervical lymph nodes (cLN), spleen, brain, and spinal cord. (J and K) (J) Absolute number of CD45.1+ 2D2-Eomes-TWT or 2D2-Eomes-TKO cells or (K) endogenous CD45.2+ CD4+ T cells was assessed at 14 dpi in the brain and SC of mice treated as in I. Data are representative of at least two independent experiments and a pool of two (G) and three independent experiments (A). Error bars = SEM; P values for cumulative and maximal scores (Mann–Whitney U test), P values for clinical scores, cytokine production, and absolute numbers (two-way ANOVA with Bonferroni correction)—****P < 0.0001, ***P < 0.001, **P < 0.01, and *P < 0.05. See also Fig. S1.

