Figure 5.
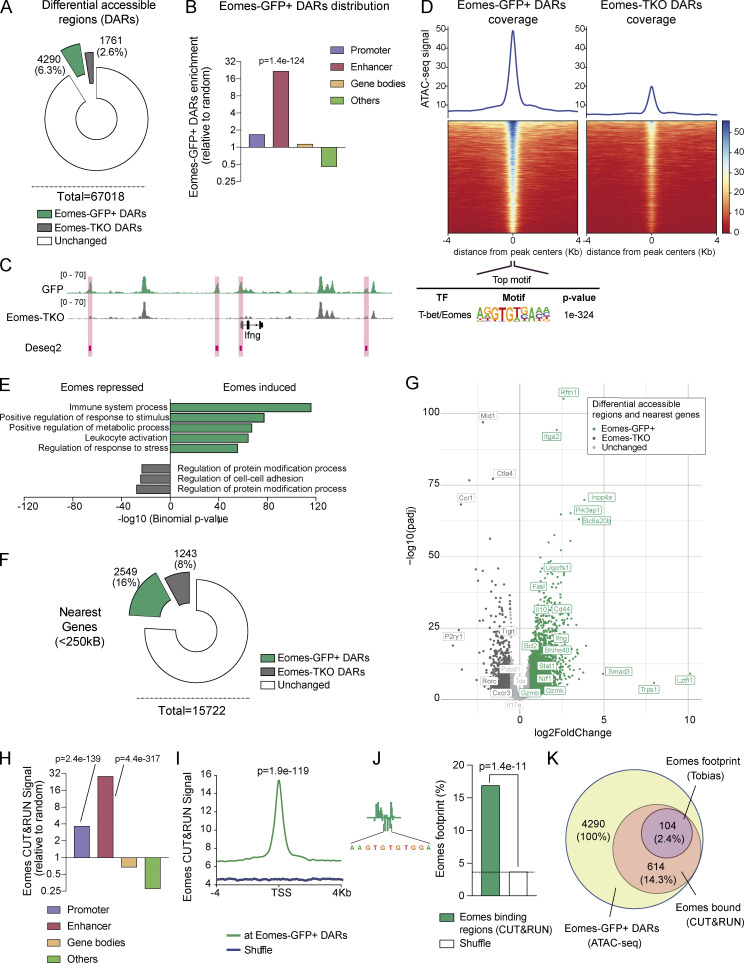
Eomes favors chromatin accessibility and directly binds to enhancer regions of genes involved in metabolic regulation. (A) Number and percentage of DARs using genome-wide analysis of chromatin accessibility of Eomes-GFP+ (green) and Eomes-TKO CD4+ T cells (gray) as determined by DESeq2 algorithm (FC > 1.5 and Padj < 0.01; n = 3/genotype). (B) Relative enrichment of Eomes-GFP+ DARs at the indicated genomic regions compared with random distribution. (C) Example of track view of the Ifng locus showing ATAC-seq results for Eomes-GFP+ (green track) and Eomes-TKO CD4+ T cells (gray track), with regions of differential accessibility (DESeq2) depicted in pink. (D) Peak density heatmap of ATAC-seq signal obtained from Eomes-GFP+ (Eomes-GFP+ DARs) or Eomes-TKO CD4+ T cells (Eomes-TKO DARs) in regions of 4 kb surrounding peak centers. Motif enrichment analyses associated with Eomes-GFP+ DARs are shown as determined using the Homer algorithm (bottom). (E) Pathway enrichment analysis of genes nearest to Eomes-GFP+ DARs identified by ATAC-seq (GREAT). (F) Number and percentage of genes nearest to Eomes-GFP+ DARs (green) and Eomes-TKO DARs (gray) identified by ATAC-seq within a 250 kb distance from transcription start site (GREAT). (G) Volcano plot of DARs and nearest genes, with Eomes-GFP+ DARs (green dots), Eomes-TKO DARs (dark gray dots), and unchanged (light gray dots) as determined by DESeq2 algorithm. (H) Relative enrichment of Eomes CUT&RUN signal at the indicated genomic elements compare to random distribution. (I) Average plot of Eomes CUT&RUN profiles comparing Eomes binding at Eomes-GFP+ DARs to random regions. (J) Example of aggregated footprint profile of Eomes motif identified by TOBIAS (left) and enrichment plot of Eomes footprint as detected in region of Eomes binding (CUT&RUN) overlapping Eomes-GFP+ DARs or shuffle regions. (K) Venn diagram showing the overlap between regions of Eomes footprint detection (TOBIAS) within regions of Eomes fixation (CUT&RUN) among regions of open chromatin in Eomes-GFP+ CD4+ T cells (ATAC-seq). P values (Pearson’s chi-square test). Also refer to Fig. S3.

