Figure 7.
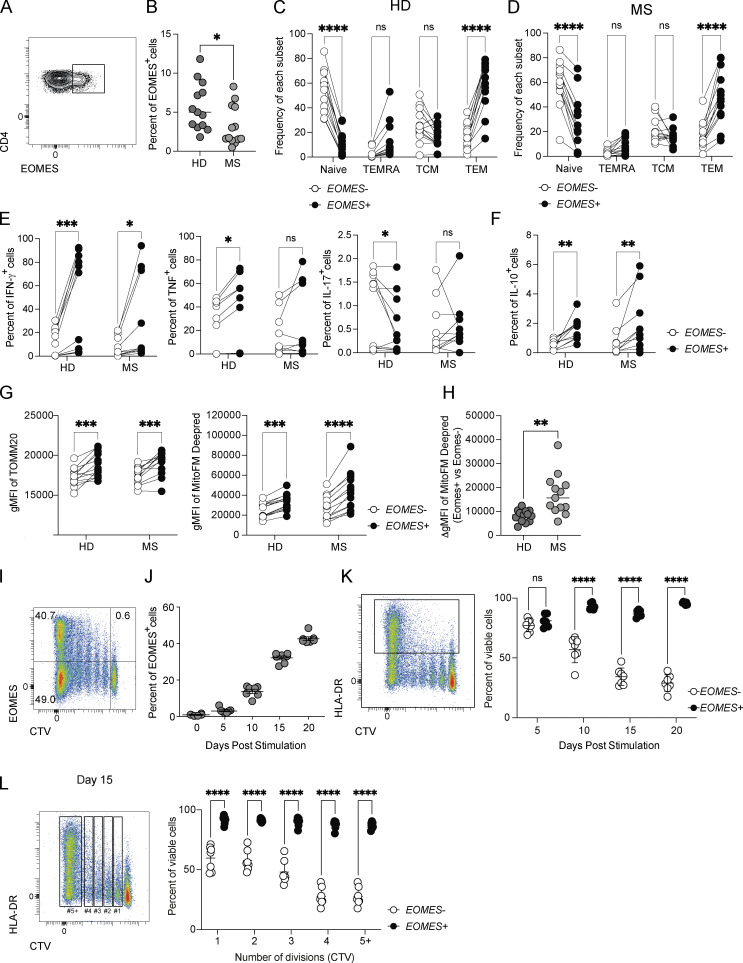
EOMES expression is linked with enhanced mitochondrial function and improves survival capacity of human CD4+ T cells from both HD and MS patients. (A) Representative dot plot of EOMES expression in total CD4+ T cells from PBMC of HD. (B) Frequencies of EOMES expression in total CD4+ T cells from HD (n = 13) and MS (n = 13) patients. (C and D) Frequencies of naïve (CCR7+CD45RA+), effector (TEMRA; CCR7−CD45RA+), central memory (TCM; CCR7+CD45RA−), or effector memory (TEM; CCR7−CD45RA−) within EOMES− and EOMES+ CD4+ T cells from (C) HD (n = 13) or (D) MS (n = 13) patients. (E and F) (E) Intracellular IFN-γ, TNF, IL-17, and (F) IL-10 expression was assessed in EOMES− and EOMES+ effector/memory CD4+ T cells from HD (n = 11) and MS (n = 10) donors after PMA/ionomycin stimulation. (G and H) (G) Mitochondrial mass (TOMM20) and mitochondrial membrane potential (MitoFM Deepred) were assessed in EOMES− and EOMES+ effector/memory CD4+ T cells from HD (n = 13) and MS (n = 13) patients and (H) the ΔgMFI of MitoFM Deepred staining in EOMES+ versus EOMES− was calculated for HD (n = 13) and MS (n = 13) patients. (I and J) (I) Dot plot of EOMES expression according to CTV dilution by CD4+ T cells purified from PBMC of HD (n = 7) and stimulated for 20 days with coated anti-CD3 and soluble anti-CD28 mAbs and (J) frequency of EOMES expression by naïve CD4+ T cells purified from PBMC of HD (n = 7) and stimulated for 5, 10, 15, or 20 days with coated anti-CD3 and soluble anti-CD28 mAbs. (K) Frequency of viable cells in HLA-DR+ CD4+ T cells from HD (n = 7) stimulated as in J for the indicated period by viability dye incorporation. (L) Frequency of viable cells according to cell division in CD4+ T cells from HD (n = 7) stimulated as in J for 15 days by viability dye incorporation. Data are representative of at least two independent experiments. Error bars = SEM; P values (two-way ANOVA with Bonferroni correction)—****P < 0.0001, ***P < 0.001, **P < 0.01, *P < 0.05. See also Fig. S5.

