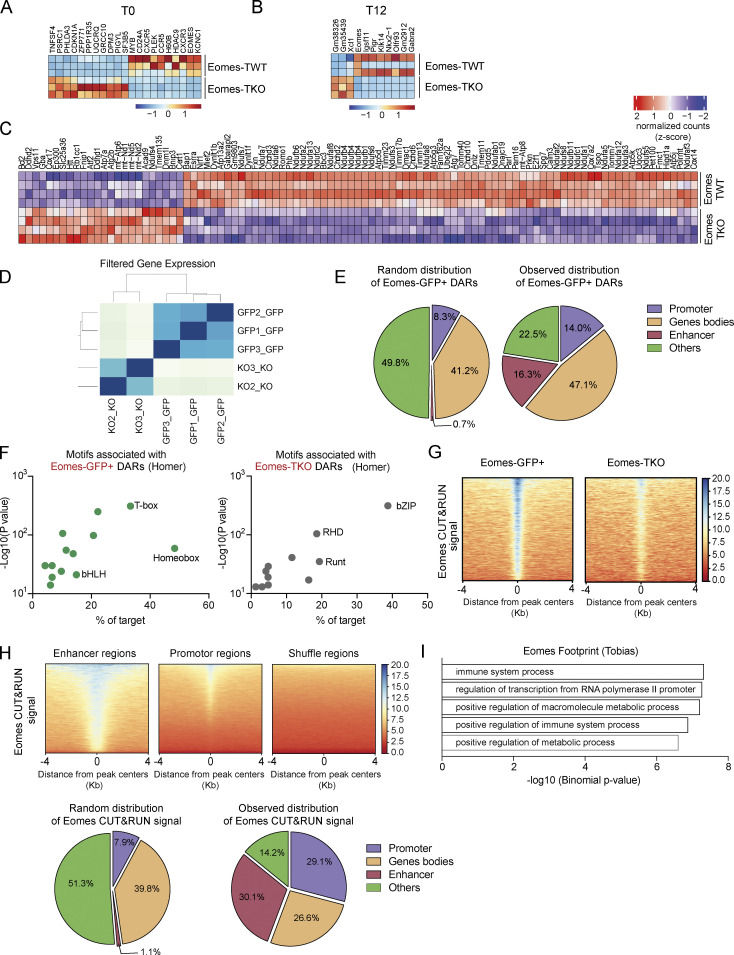
Figure S3.
Multi-omics data analysis uncovers a direct role for Eomes in the regulation of metabolism-associated genes and mitochondrial transcriptional modulators. (A and B) Heatmap of differentially expressed genes between Eomes-TKO and Eomes-TWT CD4+ T cells (A) before (T0) or (B) after stimulation in vitro for 12 h (T12) (n = 3 mice/group). (C) Heatmap of genes involved in mitochondrion organization in Eomes-TKO and Eomes-TWT CD4+ T cells stimulated with anti-CD3 and anti-CD28 mAbs for 24 h. (D) Correlation matrix of Eomes-GFP+ (n = 3) and Eomes-TKO (n = 2) ATAC-seq data. (E) Random and observed genomic distribution of Eomes-GFP+ DARs at the indicated genomic regions. (F) Motif enrichment analyses of Eomes-GFP+ (left) and Eomes-TKO (right) DARs using Homer. (G) Peak density heatmap of Eomes CUT&RUN signal from Eomes-GFP+ (left) and Eomes-TKO CD4+ T cells (right) in the region of 4 kb surrounding Eomes-GFP+ DARs centers determined by ATAC-seq. (H) Peak density heatmap of Eomes CUT&RUN signal from Eomes-GFP+ CD4+ T cells at enhancer, promoter, or shuffle regions (top). Random and observed genomic distribution of Eomes signals as determined by CUT&RUN (bottom). (I) Pathway enrichment analyses of the 88 genes nearest to regions of Eomes footprint (TOBIAS) overlapping regions of Eomes fixation (CUT&RUN) and Eomes-GFP+ DARs (ATAC-seq).

