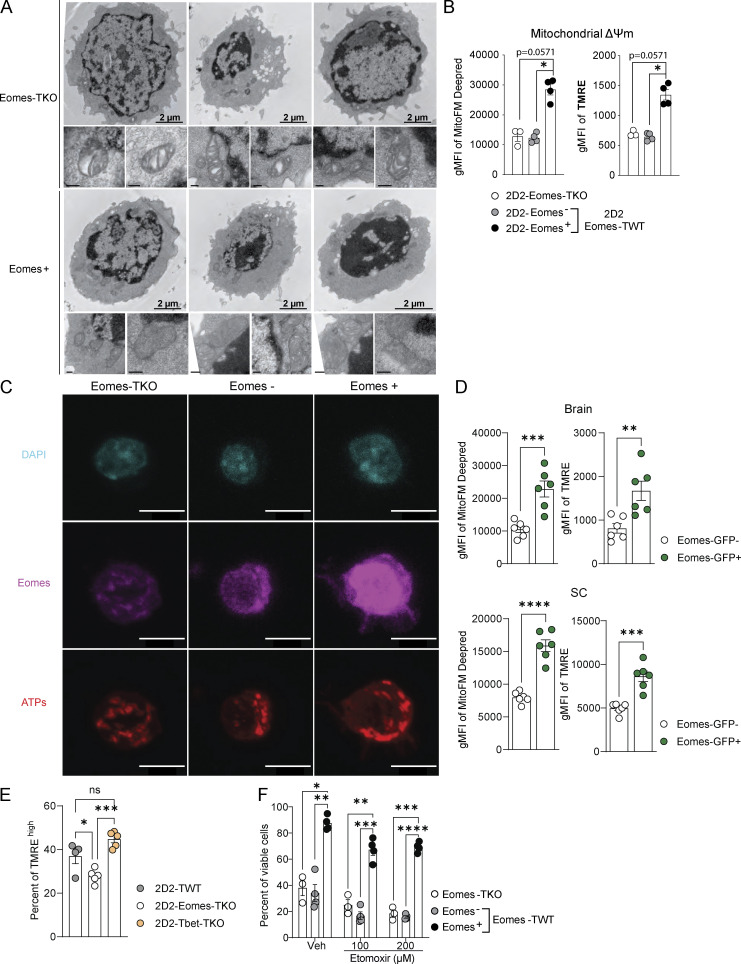
Figure S4.
Eomes deletion is associated with disorganization of mitochondrial cristae structure, decreased ATP synthase expression, and enhanced sensitivity to stress-induced cell death. (A) Mitochondrial cristae architecture was imaged and analyzed by TEM in Eomes-TKO and Eomes+ CD4+ T cells. Scale bars represent 2 µm (cell scale) and 200 nm (mitochondria scale). (B) Mitochondrial membrane potential (ΔΨm) was assessed in 2D2-Eomes-TKO, Eomes−, and Eomes+ CD4+ T cells stimulated in vitro with 1 µg/ml MOG35–55 loaded-APCs for 48 h using MitoFM DeepRed and TMRE staining (n = 3 and 4 mice/group). (C) Representative images of DAPI (blue), Eomes (pink), and ATP synthase (red) stainings in Eomes-TKO, Eomes−, and Eomes+ CD4+ T cells using confocal microscopy after 48 h of in vitro stimulation with anti-CD3 and anti-CD28 mAbs. Scale bars represent 7 µm. (D) MitoFM Deepred and TMRE stainings were analyzed in CD44high CD4+ T cells infiltrating the brain and SC upon active EAE immunization of Eomes-GFP reporter mice (n = 6 mice). (E) Mitochondrial membrane potential (ΔΨm) of 2D2-TWT, 2D2 Eomes-TKO, and 2D2-Tbet-TKO was assessed at 8 dpi in dLN using TMRE (n = 4, 5, and 5 mice, respectively). (F) Eomes-TKO and Eomes-TWT CD4+ T cells were stimulated during 48 h with anti-CD3 and anti-CD28 mAbs followed by 48 h of stimulation in the presence of high doses of etomoxir, and viable cells were identified using viability dye incorporation (n = 3 and 4 mice/group). Data are representative of two independent experiments. Error bars = SEM; P values (Mann–Whitney U test) and P values (two-way ANOVA with Bonferroni correction)—****P < 0.0001, ***P < 0.001, **P < 0.01, *P < 0.05.

