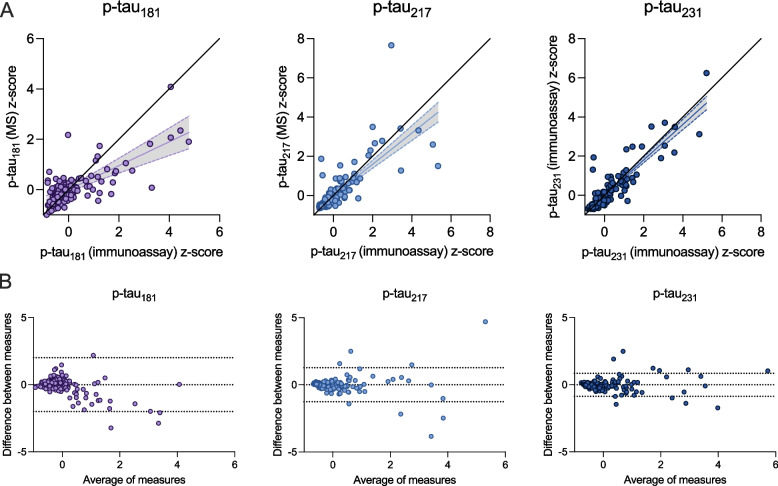
Fig. 2.
Correlations between immunoassay- and mass spectrometry-derived concentrations of p-tau in the TRIAD cohort. Top: Black lines of origin along the horizontal depict a theoretical linear relationship between variables without over- or under-estimation. The regression line and corresponding 95% confidence intervals below the origin indicates that mass spectrometry p-tau181 measurements underestimate p-tau concentrations from immunoassay measurements, which was not observed for p-tau217 or p-tau231. For p-tau181 in TRIAD (A), one data point (x = -0.45, y = 9.89) is not visually represented in the scatterplot in order to fit the plot to a comparable scale; this data point was nonetheless included in all analyses. Bottom: Bland–Altman analysis assessing bias between mass spectrometry and immunoassay measurements of p-tau. Dashed lines indicate limits of agreement, which correspond to standard deviation of the bias multiplied by 1.96. P-tau231 had the smallest bias, followed by p-tau217 and p-tau181 with the largest bias. Z-scores for each biomarker are represented to facilitate comparisons between measurements. MS = Mass spectrometry

