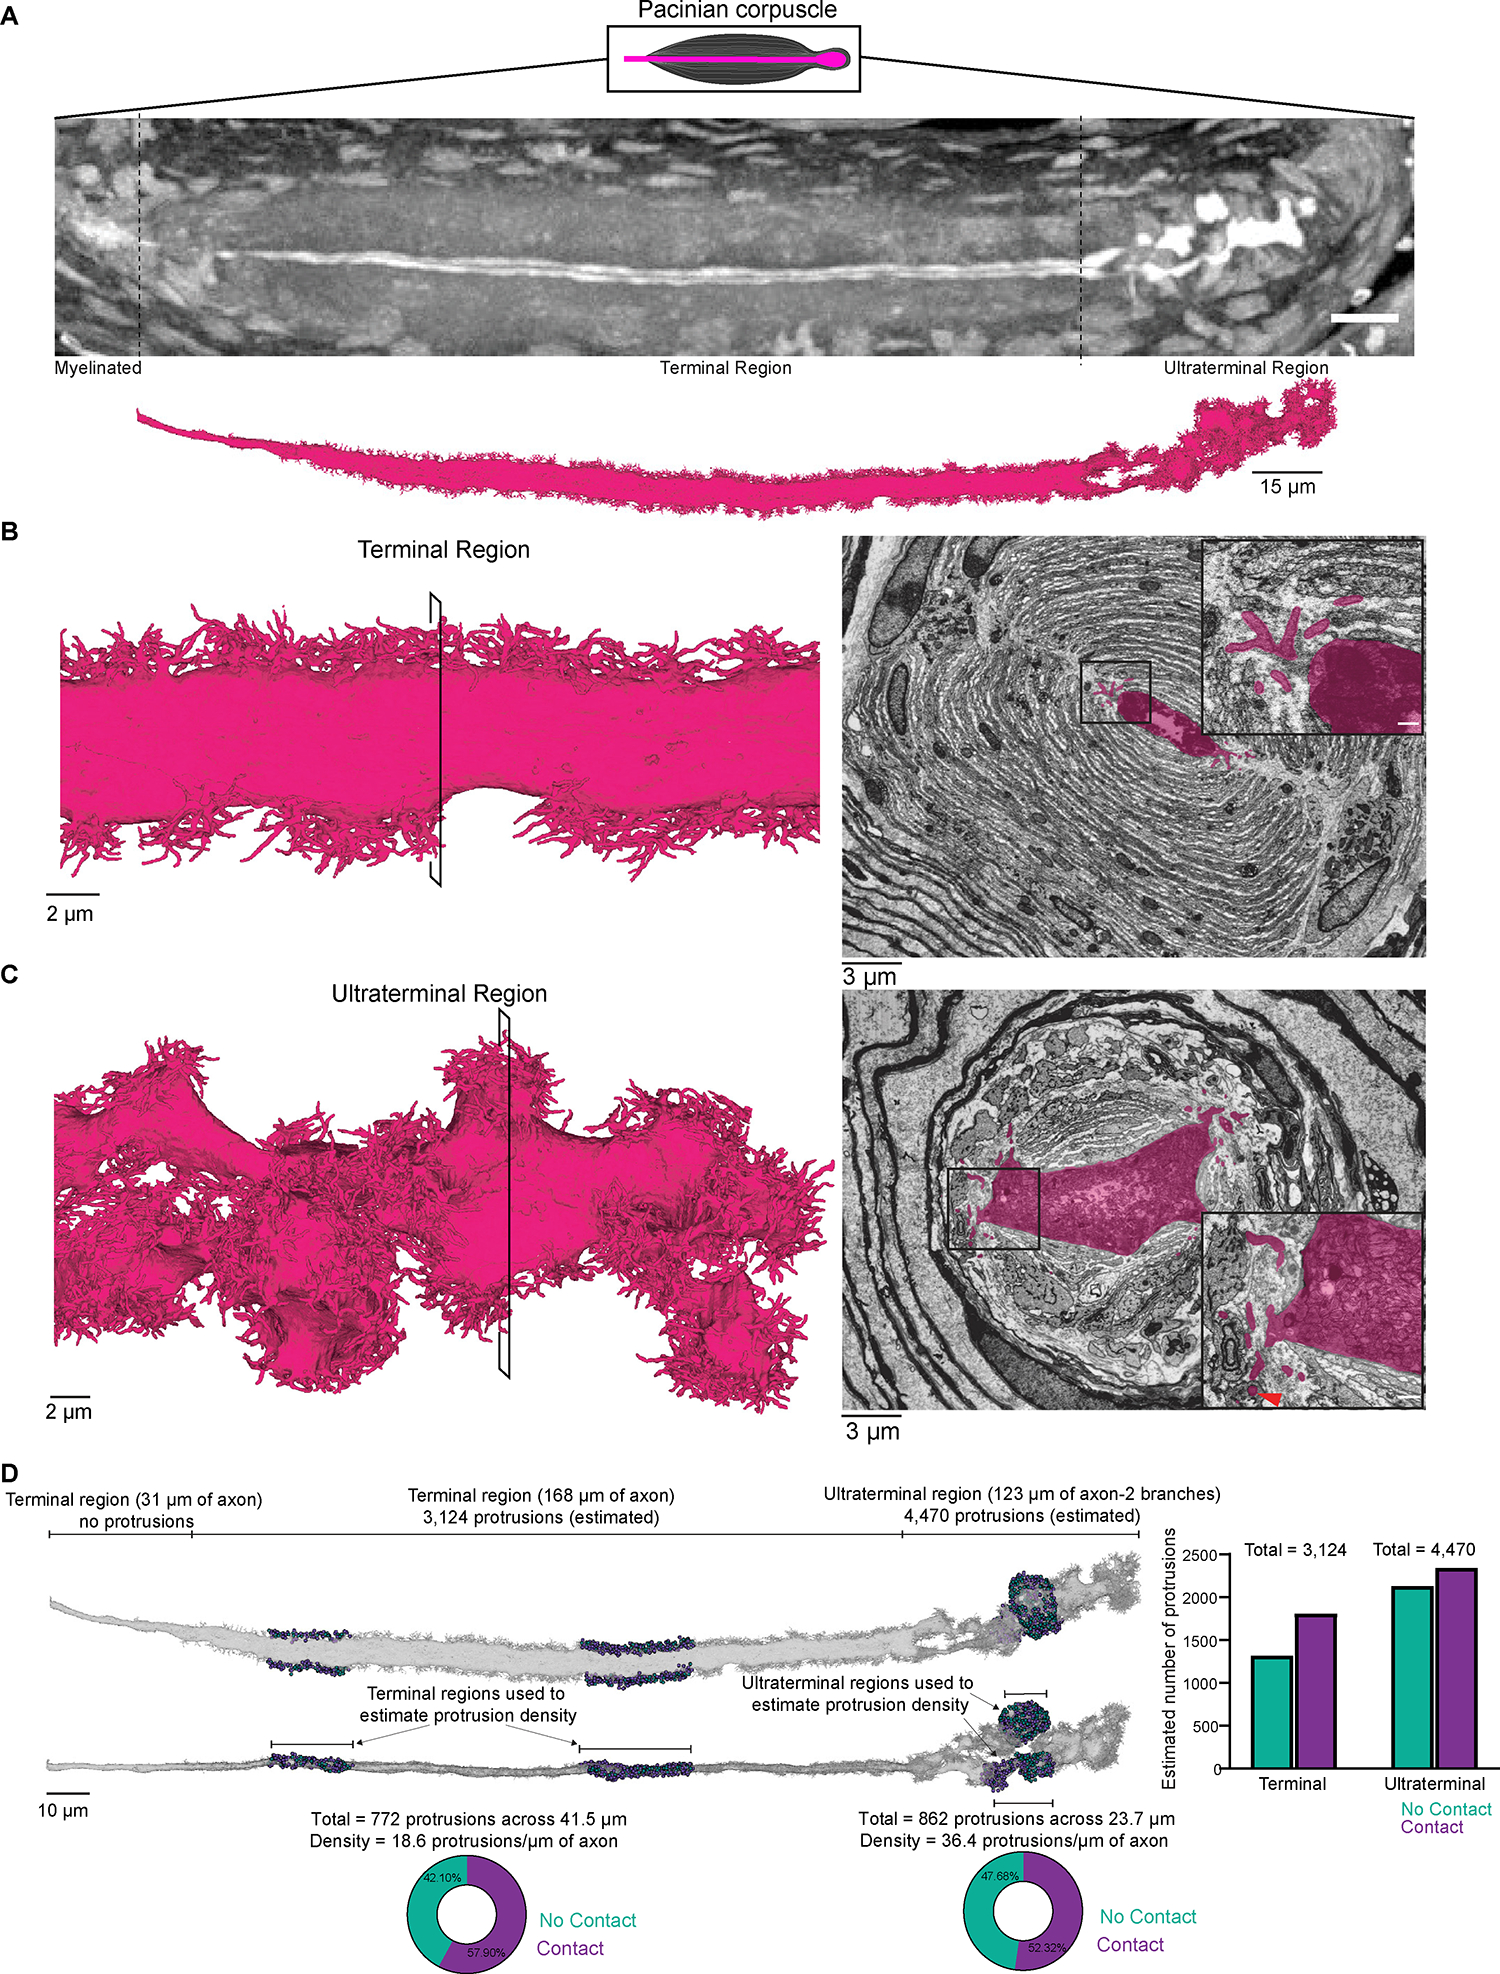
Figure 7. FIB-SEM reconstruction of a Pacinian corpuscle Aβ RA-LTMR reveals dense networks of axon protrusions that form contacts with lamellar cells.

(A) X-ray tomography of a Pacinian corpuscle (axon in white) prior to FIB-SEM imaging (top) and 3D rendering of the reconstructed Pacinian Aβ RA-LTMR after imaging (bottom).
(B) Left, 3D rendering of a section of the Aβ RA-LTMR in the terminal region. Right, pseudo-colored image from the FIB-SEM volume with inset showing protrusions and their contacts with lamellar cells.
(C) Same as in (B) except for the ultraterminal region. The red arrowhead indicates a protrusion encased by a lamellar cell at the inner and outer core boundary.
(D) Characterization of protrusion terminals in the terminal and ultraterminal region. Two representative regions in the terminal and ultraterminal region (total of 4) were selected to quantify and characterize protrusion terminals. The pie charts show the percentage of protrusions within these regions that contact a lamellar cell (purple) or do not form a contact (teal). The statistics of protrusion terminals in these regions were used to estimate the total number of protrusions and their termination type within both the terminal and ultraterminal region (graphed on the right). See also Figure S7.
