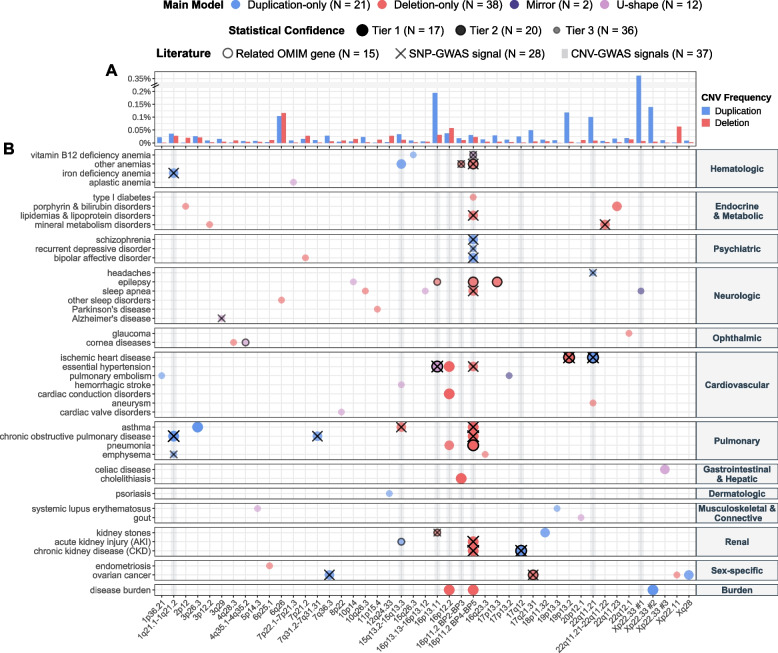
Fig. 2.
CNV-disease association map. A Duplication and deletion frequencies ([%]; y-axis; break: //) of the lead probe for each unique and non-overlapping disease-associated CNV region (CNVR), labeled with corresponding cytogenic band (x-axis; 16p11.2 is split to distinguish the distal 220 kb BP2-3 and proximal 600 kb BP4-5 CNVRs; non-overlapping CNVRs on the same cytogenic band are numbered). If signals mapping to the same CNVR have different lead probes, the maximal frequency was plotted. B Associations between CNVRs (x-axis) and diseases (y-axis) identified through CNV-GWAS. Color indicates the main association model. Size and transparency reflect the statistical confidence tier. Black contours indicate overlap with OMIM gene causing a disease with shared phenotypic features. Black crosses indicate overlap with SNP-GWAS signal for a related trait. Gray shaded vertical lines indicate CNVRs with continuous trait associations [27]. N provides count for various features

