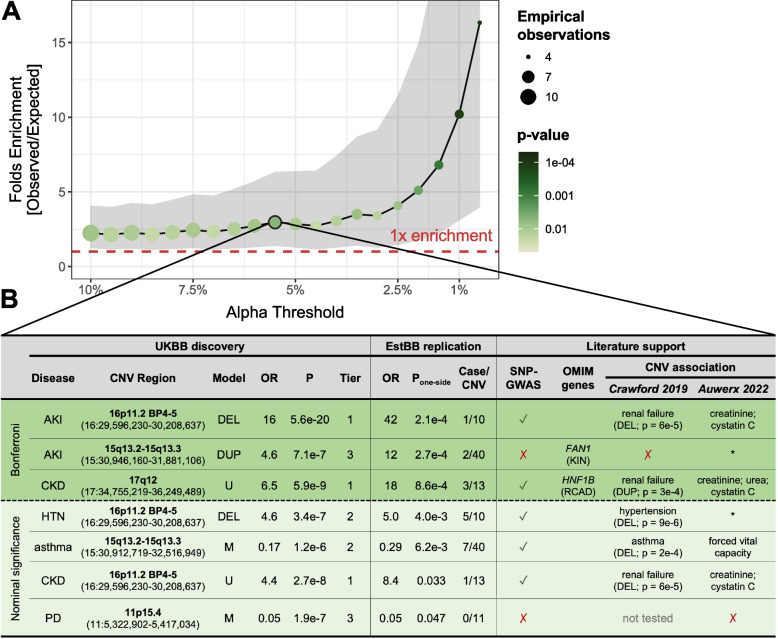
Fig. 3.
Replication of CNV-disease associations in the Estonian Biobank. A Enrichment for signal replication (y-axis; 95% confidence interval as gray ribbon) at different levels of significance (alpha; x-axis) in the Estonian Biobank (EstBB). Color and size indicate the p-value of the enrichment (one-sided binomial test) and the number of observed associations, respectively. Dashed red line indicates one-fold enrichment, i.e., the number of observed associations matches the number of expected ones. B Associations replicated at nominal significance in the EstBB, color-stratified according to whether they meet the replication (p ≤ 1.0 × 10⁻³; green) or nominal (p ≤ 0.05; light green) significance threshold. Disease (CKD = chronic kidney disease; AKI = acute kidney injury; HTN = hypertension; PD = Parkinson’s disease), cytogenic band and coordinates, best model (M = mirror; U = U-shape; DUP = duplication-only; DEL = deletion-only), odds ratio (OR), p-value (P), and statistical confidence tier are given for the UK Biobank (UKBB) discovery analysis. OR, one-sided p-values, and number of cases among CNV carriers are provided for the EstBB replication. Overlap with SNP-GWAS signals for a related trait (✓ = yes; ✗ = no) or a relevant OMIM gene (RCAD = renal cyst and diabetes; KIN = karyomegalic interstitial nephritis) is indicated. Previous association with diseases [24] (duplication (DUP) or deletion (DEL) was associated with indicated disease; no association (✗); some CNVRs were not tested) and continuous traits [27] (disease-relevant biomarkers are specified; other traits (*); no association (✗)) are listed

