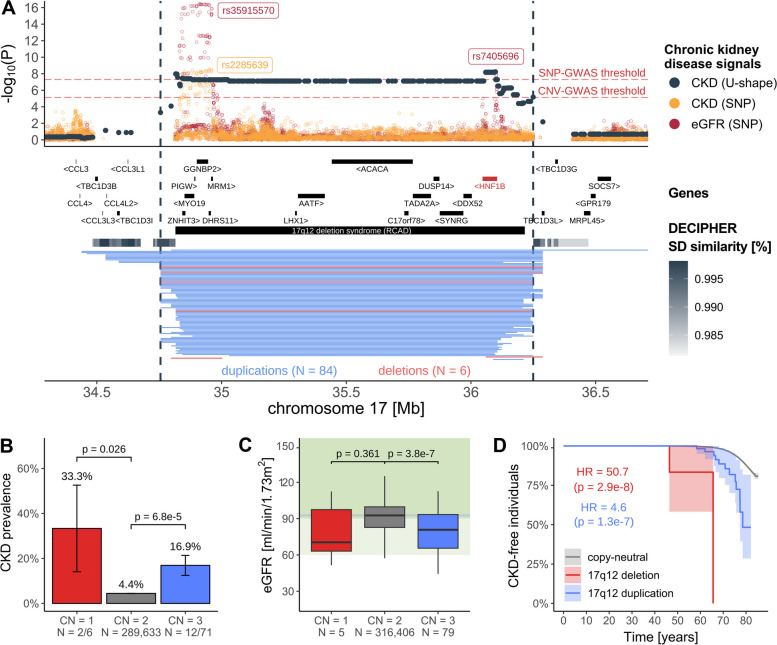
Fig. 4.
Increased and decreased dosage of 17q12 impairs kidney function. A 17q12 association landscape. Top: Negative logarithm of association p-values of CNVs (dark gray; CNV region (CNVR) delimited by vertical dashed lines) and single-nucleotide polymorphisms (SNPs) with chronic kidney disease (CKD; orange) [71] and SNPs with estimated glomerular filtration rate (eGFR; red) [72]. Lead SNPs are labeled. Red horizontal dashed lines represent the genome-wide threshold for significance for CNV-GWAS (p ≤ 7.5 × 10⁻⁶) and SNP-GWAS (p ≤ 5 × 10⁻⁸). Middle: Genomic coordinates of genes and DECIPHER GD, with HNF1B, the putative causal gene in red. Segmental duplications are represented as a gray gradient proportional to the degree of similarity. Bottom: Genomic coordinates of duplications (blue) and deletions (red) of UK Biobank participants overlapping the region. B CKD prevalence (± standard error) according to 17q12 copy-number (CN). P-values compare deletion (CN = 1) and duplication (CN = 3) carriers to copy-neutral (CN = 2) individuals (two-sided Fisher test). Number of cases and samples sizes are indicated (N = cases/sample size). C eGFR levels according to 17q12 CN, shown as boxplots; outliers are not shown. P-value comparisons as in B (two-sided t-test). Gray horizontal line represents median eGFR in non-carriers. Light and darker green background represent mildly decreased (60–90 ml/min/1.73m2) and normal (≥ 90 ml/min/1.73 m.2) kidney function, respectively. D Kaplan–Meier curve depicting the percentage, with 95% confidence interval, of individuals free of CKD over time among copy-neutral and 17q12 deletion and duplication carriers. Hazard ratio (HR) and p-value for deletion and duplication are given (CoxPH model)

