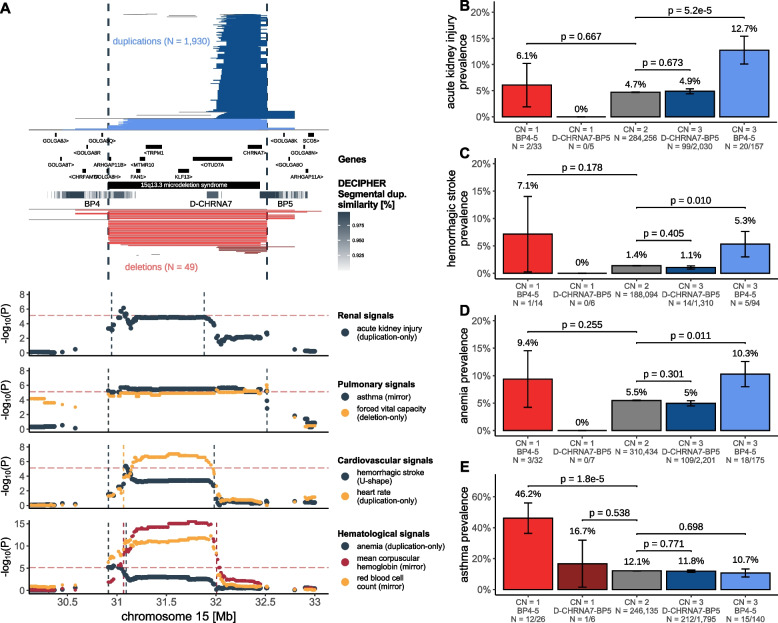
Fig. 6.
Dissection of complex pleiotropic patterns of recurrent CNVs at 15q13. A 15q13 genetic landscape. Top: Coordinates of duplications (shades of blue; top) and deletions (shades of red; bottom) overlapping the maximal CNV region (CNVR; delimited by vertical dashed lines) associated with acute kidney injury (AKI), asthma, forced vital capacity, hemorrhagic strokes, heart rate, anemia, mean corpuscular hemoglobin, and red blood cell count. CNVs are divided and colored according to whether they span breakpoint (BP) 4 to 5 or D-CHRNA7 to BP5, with atypical CNVs in gray (Additional file 1: Note 6). Breakpoints reflect segmental duplications, represented as a gray gradient proportional to the degree of similarity. Genomic coordinates of genes and DECIPHER GD are displayed. Bottom: Negative logarithm of association p-values of CNVs (best model in parenthesis) with renal, pulmonary, cardiovascular, and hematological traits. Traits-specific CNVRs are shown with vertical dashed lines. Red horizontal dashed line represents the genome-wide threshold for significance for CNV-GWAS (p ≤ 7.5 × 10⁻⁶). B, C, D, E Prevalence (± standard error) of B AKI, C hemorrhagic stroke, D anemia, and E asthma according to 15q13 copy-number (CN) and groups from A. P-values compare BP4-5 and D-CHRNA7-BP5 deletion (CN = 1) and duplication (CN = 3) carriers to copy-neutral (CN = 2) individuals (two-sided Fisher test). Number of cases and sample sizes are indicated (N = cases/sample size)

