Fig. 7.
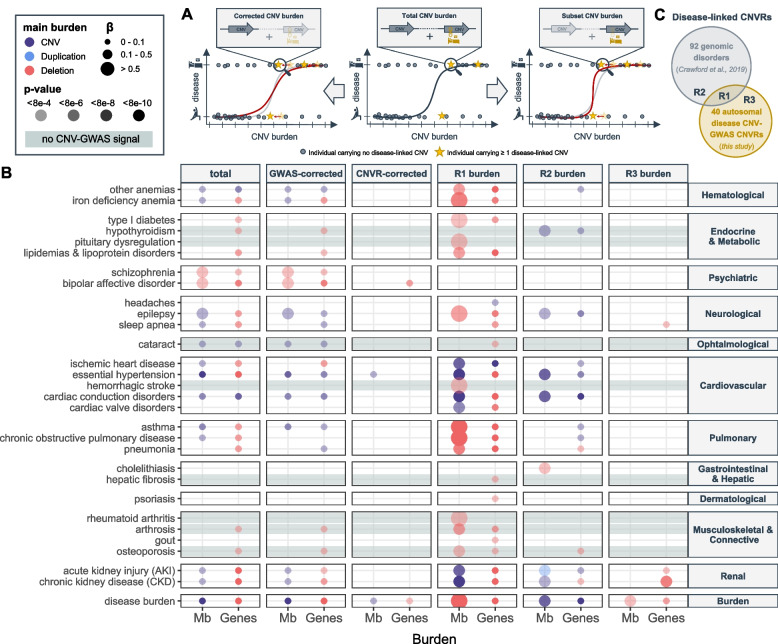
CNV burden at known genomic disorder CNVRs increases overall disease risk. A Burden calculation. Middle: Total CNV (duplication + deletion), duplication, or deletion burdens are calculated by summing up the length (in number of affected Mb or genes) of all CNVs, duplications, or deletions in an individual, respectively. Burden values are used as a predictor for disease risk. Left: Corrected burdens are calculated by summing up the length of all CNVs, duplications, or deletions that do not overlap with regions listed in a given genomic partition. Right: Subset burdens are calculated by summing up the length of all CNVs, duplications, or deletions that overlap with regions listed in a given genomic partition. Both corrected and subset burden values are used to re-estimate contribution of the CNV burden to disease risk (red curve). B Contribution of the total burden, CNV-GWAS signal- and CNVR-corrected burdens, and the R1, R2, and R3 subset burdens measured in number of affected Mb (x-axis; left) or genes (x-axis; right) to disease risk (y-axis). Only the effect of the most significantly associated of the CNV (purple), duplication (blue), or deletion (red) burdens, providing p ≤ 0.05/61 = 8.2 × 10⁻⁴, is shown. Color indicates whether the CNV, duplication, or deletion burden was most significantly associated, with size and transparency being proportional to the effect size (beta) and p-value, respectively. Gray horizontal bands mark traits with no CNV-GWAS signal. C Schematic representation of the R1, R2, and R3 partitions used to define the subset burdens in B

