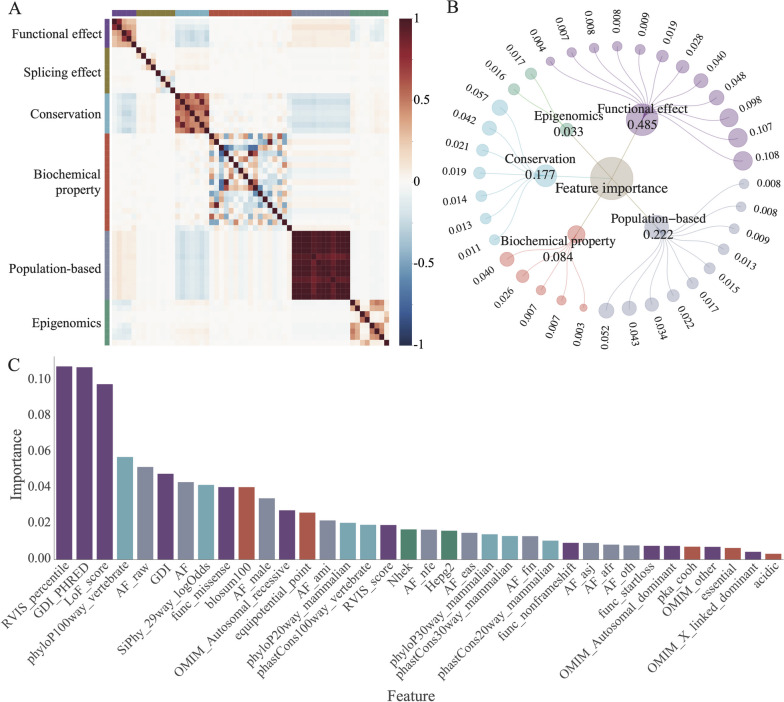
Fig. 2.
Feature importance and correlation. A Correlation between features used to train MAGPIE. B A captivating hierarchical relationship diagram is presented, displaying the intricate relationship between features and the categories they belong to. Each dot in the outermost layer represents a distinct feature, while the size of the dots indicates their importance. The second layer depicts feature categories, with the size reflecting the sum of importance of the subordinate features. C The bar plot illustrates feature importance, which shows the contribution of each feature after feature selection. Part of the add-on features is automatically removed during the training process

