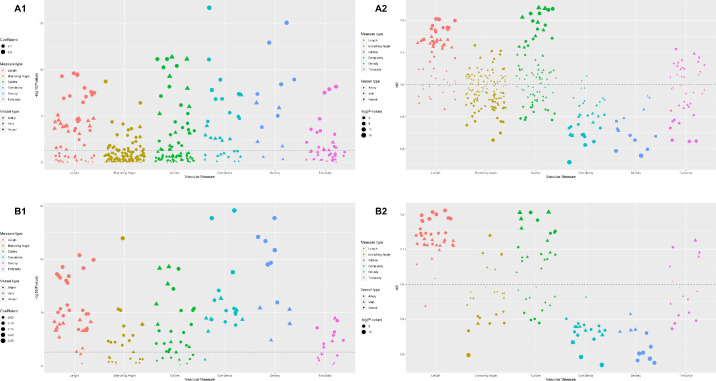
Figure 3.
HRs and FDR-adjusted P values of retinal vascular measurements for premature mortality. (A1) FDR-adjusted P values of retinal vascular measurements in the training set. (A2) HRs of retinal vascular measurements in the training set. (B1) FDR-adjusted P values of retinal vascular measurements in the validation set. (B2) HRs of retinal vascular measurements in the validation set. All P values in the figure were FDR adjusted.

