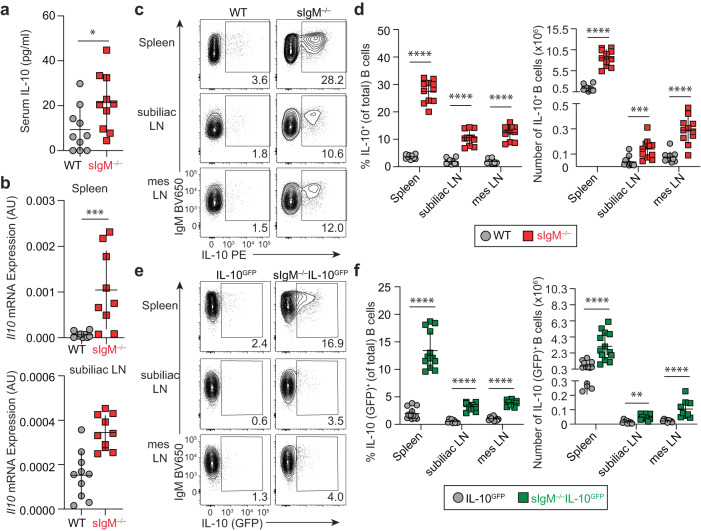
Fig. 1. Mice lacking secreted IgM have increased IL-10+ B cells.
a Serum concentration of IL-10 in naive WT and sIgM–/– mice by ELISA (WT n = 10, sIgM–/– n = 10, *p = 0.0230). b Relative expression of Il10 transcript in cells isolated from the spleen and subiliac lymph node (LN) of WT and sIgM–/– mice at basal state determined by qPCR (Spleen: WT n = 10, sIgM–/– n = 9; ***p = 0.0010; subiliac LN: WT n = 10, sIgM–/– n = 10, ***p = 0.0007). c Representative flow cytometry staining of IL-10 protein in WT and sIgM–/– B cells (pregated on singlets, lymphocytes, Live/Dead– CD4–, CD19+) from the spleen, subiliac LN, and mesenteric (mes) LN after 4 h stimulation with phorbol 12-myristate 13-acetate/ionomycin/lipopolysaccharide. d Quantification of the percent and total number of IL-10+ B cells for each individual organ (WT n = 11, sIgM–/– n = 11; Left, percent IL-10+ B cells: spleen ****p < 0.0001, subiliac LN ****p < 0.0001, mes LN ****p < 0.0001; right, number of IL-10+ B cells: spleen ****p < 0.0001, subiliac LN ***p = 0.0003, mes LN ****p < 0.0001). e Representative flow cytometry of IL-10 (GFP) expression in B cells directly ex vivo from IL-10GFP and sIgM–/–IL-10GFP reporter mice. f Quantification of the percent and total number IL-10+ B cells for each individual organ (Left, percent IL-10+ B cells: spleen (IL-10GFP n = 13, sIgM–/–IL-10GFP n = 13) ****p < 0.0001, subiliac LN (IL-10GFP n = 9, sIgM–/–IL-10GFP n = 9) ****p < 0.0001, and mes LN (IL-10GFP n = 9, sIgM–/–IL-10GFP n = 9) ****p < 0.0001; right, number of IL-10+ B cells: spleen (IL-10GFP n = 9, sIgM–/–IL-10GFP n = 9) ****p < 0.0001, subiliac LN (IL-10GFP n = 9, sIgM–/–IL-10GFP n = 9) **p = 0.0012, mes LN (IL-10GFP n = 9, sIgM–/–IL-10GFP n = 9) ****p < 0.0001). Data points indicate mean ± SD, and each symbol represents one mouse. P values were calculated using two-tailed Mann–Whitney U test (a, b, d, f). Data are pooled from 2 (b) or 3 (a, d, f) independent experiments. Source data are provided with this paper.

