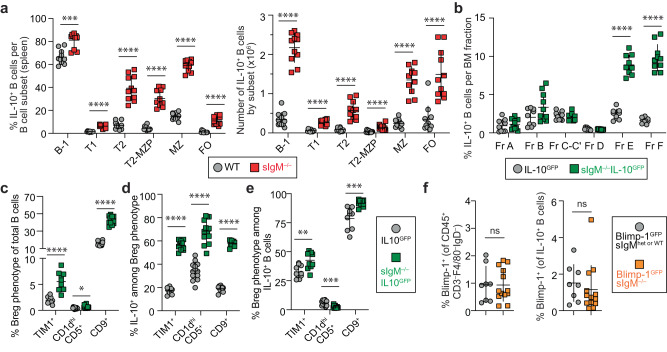
Fig. 2. Lack of secreted IgM increases IL-10+ B cells among all major B-cell subsets and Breg phenotypes.
a Cells were stimulated with phorbol 12-myristate 13-acetate/ionomycin/lipopolysaccharide (P/I/L) for 4-h and gated on singlets, lymphocytes, live/dead (L/D) stain–CD45+CD4–CD19+, followed by markers specific to each B-cell subset: B-1: B220lo/–CD43+; and B-2: B220hiCD43–; B-2 cells were further subdivided as transitional-1 (T1): CD24hiCD21lo/–; transitional-2 (T2): CD24hiCD21int; transitional-2-marginal zone precursor (T2-MZP): CD24hiCD21hiCD23+; marginal zone (MZ): CD24hiCD21hiCD23–; and follicular (FO): CD24intCD21intCD23+. The percent and total number of IL-10+ B cells in each B-cell subset in the spleen of WT and sIgM–/– mice. (WT n = 11, sIgM–/– n = 11; left, percent IL-10+ B cells: B1 ***p = 0.0002, T1 ****p < 0.0001, T2 ****p < 0.0001, T2-MZP ****p < 0.0001, MZ ****p < 0.0001, FO ****p < 0.0001; right, number of IL-10+ B cells: B1 ****p < 0.0001, T1 ****p < 0.0001, T2 ****p < 0.0001, T2-MZP ****p < 0.0001, MZ ****p < 0.0001, FO ****p < 0.0001). b Bone marrow (BM) cells were assessed after 4-h stimulation with P/I/L for B-cell fractions according to the Hardy scheme. Cells were gated on singlets, Live/Dead (L/D) stain–CD3–F4/80–NK1.1–Gr-1–B220+. B220+ BM cells were further subdivided into Hardy Fractions (Fr.): Fr. A: B220+CD43+IgM–BP1–CD24–; Fr. B: B220+CD43+IgM–BP1–CD24+; Fr. C-C’: B220+CD43+IgM–BP1+CD24+; Fr. D: B220+CD43–IgM–IgD–; Fr. E: B220+CD43–IgM+IgD–; and Fr. F: B220+CD43–IgM+/–IgD+. (IL-10GFP n = 9, sIgM–/–IL-10GFP n = 10; percent IL-10+ B cells: Fr. A p = 0.3562, Fr. B p = 0.1823, Fr. C-C’ p = 0.3249, Fr. D p = 0.3555, Fr. E ****p < 0.0001, Fr. F ****p < 0.0001). c Breg phenotype identified by expression of TIM1+, CD1dhiCD5+, or CD9+ among total splenic B cells without stimulation in sIgM–/–IL-10GFP mice. (TIM1+: IL-10GFP n = 10, sIgM–/–IL-10GFP n = 10, ****p < 0.0001; CD1dhiCD5+: IL-10GFP n = 13, sIgM–/–IL-10GFP n = 13, *p < 0.0106; CD9+: IL-10GFP n = 13, sIgM–/–IL-10GFP n = 13, ****p < 0.0001). d, e Splenocytes were stimulated for 4-h with P/I/L. d Frequency of IL-10+ B cells among each Breg phenotype. (TIM1+: IL-10GFP n = 10, sIgM–/–IL-10GFP n = 10, ****p < 0.0001; CD1dhiCD5+: IL-10GFP n = 13, sIgM–/–IL-10GFP n = 13, ****p < 0.0001; CD9+: IL-10GFP n = 9, sIgM–/–IL-10GFP n = 9, ****p < 0.0001). e Breg phenotype+ cells among IL-10+ B cells. (TIM1+: IL-10GFP n = 10, sIgM–/–IL-10GFP n = 10, **p < 0.0089; CD1dhiCD5+: IL-10GFP n = 13, sIgM–/–IL-10GFP n = 13, ***p < 0.0003; CD9+: IL-10GFP n = 9, sIgM–/–IL-10GFP n = 9, ***p < 0.0005). f Plasma cell (PC) identity was assessed by flow cytometry directly ex vivo on L/D stain–CD45+CD3–F4/80–IgD– lymphocytes using sIgM–/– mice crossed with Blimp-1GFP reporter mice (left) and among IL-10+ B cells after 4-h stimulation with P/I/L (right). (Blimp-1GFPsIgMhet or WT n = 13, Blimp-1GFPsIgM–/– n = 8; Left, Percent Blimp-1+ of PCs, p = 0.8457; Right, percent Blimp-1+ of IL-10+ B cells: p = 0.2169. Data points indicate mean ± SD, and each symbol represents one mouse. P values were calculated using two-tailed Mann–Whitney U test (a–f); not significant (ns). Data are pooled from 2 (b; c–e: TIM1+/CD9+) or 3 (a; c–e: CD1dhiCD5+; f) independent experiments. Source data are provided with this paper.

