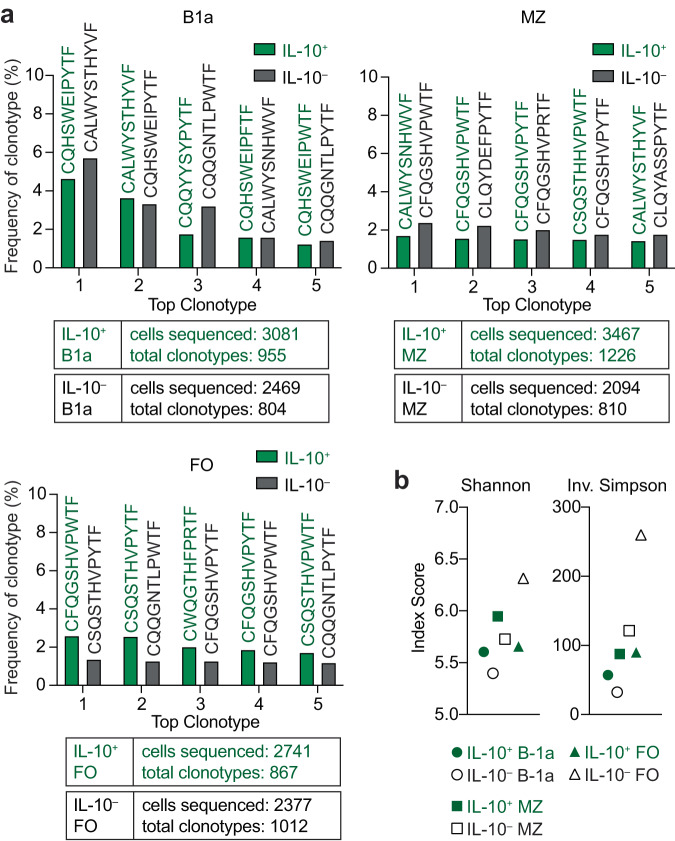
Fig. 3. IL-10+ B cells from sIgM–/– mice are polyclonal.
Single-cell light chain clonotype analysis using the 10X Genomics platform of FACS-sorted IL-10+ (green) and IL-10– (black) B-1a, marginal zone (MZ), and follicular (FO) B cells from sIgM–/–IL-10GFP mouse after 4-h stimulation with phorbol 12-myristate 13-acetate/ionomycin/lipopolysaccharide, gated as in Supplementary Fig. 4. Il10 transcript-expressing cells were removed from GFP– sorted populations. Data were analyzed with Cell Ranger VDJ Scripts and plotted using R. a The percentage of top five individual clonotypes from each sample is shown with the corresponding CDR3 sequence listed on top. The total cells analyzed and total clonotypes identified are indicated below graphs. Complete information on VJ gene usage and nucleotide sequences found in Supplementary Data 1. b Diversity indexes (Shannon and Inverse Simpson) were assessed for the 6 samples using scRepertoire.

