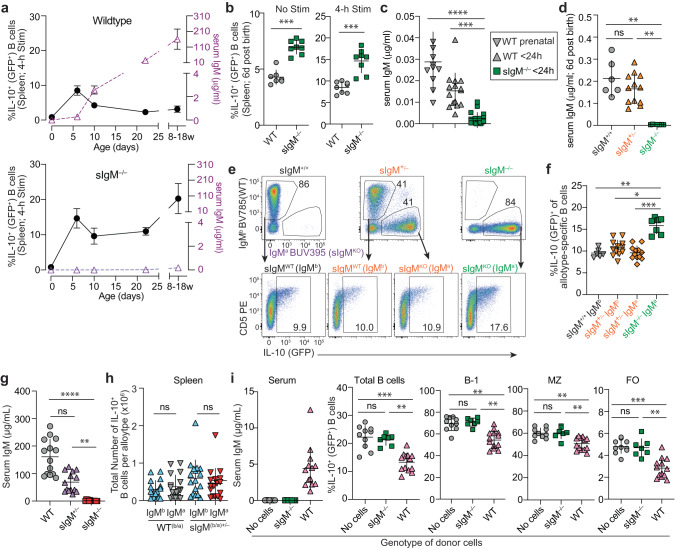
Fig. 4. SIgM is produced perinatally and limits the expansion of IL-10+ B cells.
a Flow cytometric analysis of splenic IL-10+ B cells at <24 h post birth, d6, d10, d22, and adult mice (8–18 weeks) (left y axis; black) after 4-h stim with phorbol 12-myristate 13-acetate/ionomycin/lipopolysaccharide (P/I/L) and serum IgM by ELISA (right y axis; purple) of WT and sIgM–/– mice. WT serum (<24 h n = 15, d6 n = 8, d10 n = 7, d22 n = 10, adult n = 14); WT IL-10GFP percent IL-10+ B cells (<24 h n = 7, d6 n = 8, d10 n = 7, d22 n = 10, adult n = 18); sIgM–/– serum (<24 h n = 19, d6 n = 8, d10 n = 8, d22 n = 10, adult n = 9); sIgM–/–IL-10GFP percent IL-10+ B cells (<24h n = 8, d6 n = 8, d10 n = 8, d22 n = 10, adult n = 18). b Splenic IL-10+ B cells from WT and sIgM–/– mice at basal state (left, IL-10GFP n = 7, sIgM–/–IL-10GFP n = 8, ***p = 0.0003) and after 4-h P/I/L stimulation (right, IL-10GFP n = 8, sIgM–/–IL-10GFP n = 8, ***p = 0.0002). c Serum IgM levels in prenatal WT (~E20-21, n = 11) and <24 h post birth in WT (n = 15) and sIgM–/– (n = 19) mice (WT prenatal vs. WT < 24 h p = 0.2131, WT prenatal vs. sIgM–/– < 24 h ****p < 0.0001, WT < 24 h vs. sIgM–/– < 24 h ***p < 0.0003). d–f Analysis of sIgM+/+IL-10GFP, sIgM+/–IL-10GFP and sIgM–/– IL-10GFP littermates. d Serum IgM from day 6 post birth (sIgM+/+IL-10GFP n = 6, sIgM+/–IL-10GFP n = 12 and sIgM–/–IL-10GFP n = 7; +/+ vs. +/– p > 0.9999, +/+ vs. –/– **p > 0.0016, +/– vs. –/– **p > 0.0026). e Representative flow cytometric analysis of splenic B cells gated on IgMa (sIgM-knockout allele) and IgMb (sIgM-wildtype allele) and assessed for IL-10 (GFP) expression after 4-h P/I/L stimulation. f Frequency of IL-10+ B cells based on allotype expressed (sIgM+/+IL-10GFP n = 6, sIgM+/–IL-10GFP n = 12 and sIgM–/–IL-10GFP n = 7; sIgM+/+IgMb vs. sIgM+/–IgMb p > 0.9999, sIgM+/+IgMb vs. sIgM+/–IgMa p > 0.9999, sIgM+/+IgMb vs. sIgM–/–IgMa **p > 0.0033, sIgM+/–IgMb vs. sIgM+/–IgMa p > 0.9999, sIgM+/–IgMb vs. sIgM–/–IgMa *p = 0.0297, sIgM+/–IgMa vs. sIgM–/–IgMa ***p = 0.0004). g, h Analysis of adult F1 offspring of WT.IgHa/a x WT.IgHb/b and sIgM–/–.IgHa/a x WT.IgHb/b mice. g Serum IgM concentration determined by ELISA in adult WT (n = 14), sIgM+/– (n = 14), and sIgM–/– (n = 14) mice (WT vs. Het p = 0.0678, WT vs KO ****p < 0.0001, Het vs. KO **p = 0.0021). h Flow cytometric analysis of splenic B cells, gated on IgMa and IgMb and assessed for IL-10 expression after 4-h P/I/L stimulation. Total number of IL-10+ B cells per allotype in spleen (WT.IgHb/a n = 17, IgMb+ vs. IgMa+ p = 0.4958; sIgM+/–(b/a) n = 17, IgMb+ vs. IgMa+ p = 0.2415). i sIgM–/–IL-10GFP mice 5–8 weeks after adoptive transfer of WT or sIgM–/– PerC cells. Serum IgM by ELISA (Donor cell genotype: no cells, n = 10, sIgM–/– n = 7, WT n = 13) and flow cytometric analysis of IL-10 (GFP) in splenic B-cell subsets after 4-h P/I/L stimulation (Donor cell genotype: no cells, n = 10, sIgM–/– n = 7, WT n = 13. % IL-10+ of Total B cells: No cells vs. sIgM–/– p > 0.9999, No cells vs. WT **p = 0.0002, sIgM–/– vs. WT **p = 0.0068; percent IL-10+ of B-1 B cells: No cells vs. sIgM–/– p > 0.9999, No cells vs. WT **p = 0.0015, sIgM–/– vs. WT **p = 0.0023; percent IL-10+ of MZ B cells: No cells vs. sIgM–/– p > 0.9999, No cells vs. WT **p = 0.0032, sIgM–/– vs. WT **p = 0.0049; percent IL-10+ of FO B cells: No cells vs. sIgM–/– p > 0.9999, No cells vs. WT ***p = 0.0007, sIgM–/– vs. WT **p = 0.0088). a–i Data points indicate mean ± SD, and each symbol represents one mouse. P values were calculated using two-tailed Mann–Whitney U test (b, h) and Kruskal–Wallis test with Dunn’s multiple comparisons test (c, d, f, g, i); not significant (ns). Data are pooled from 2 (d, f, h), 3 (c, g, i), 4 (b) or 6 (a) independent experiments. Source data are provided with this paper.

