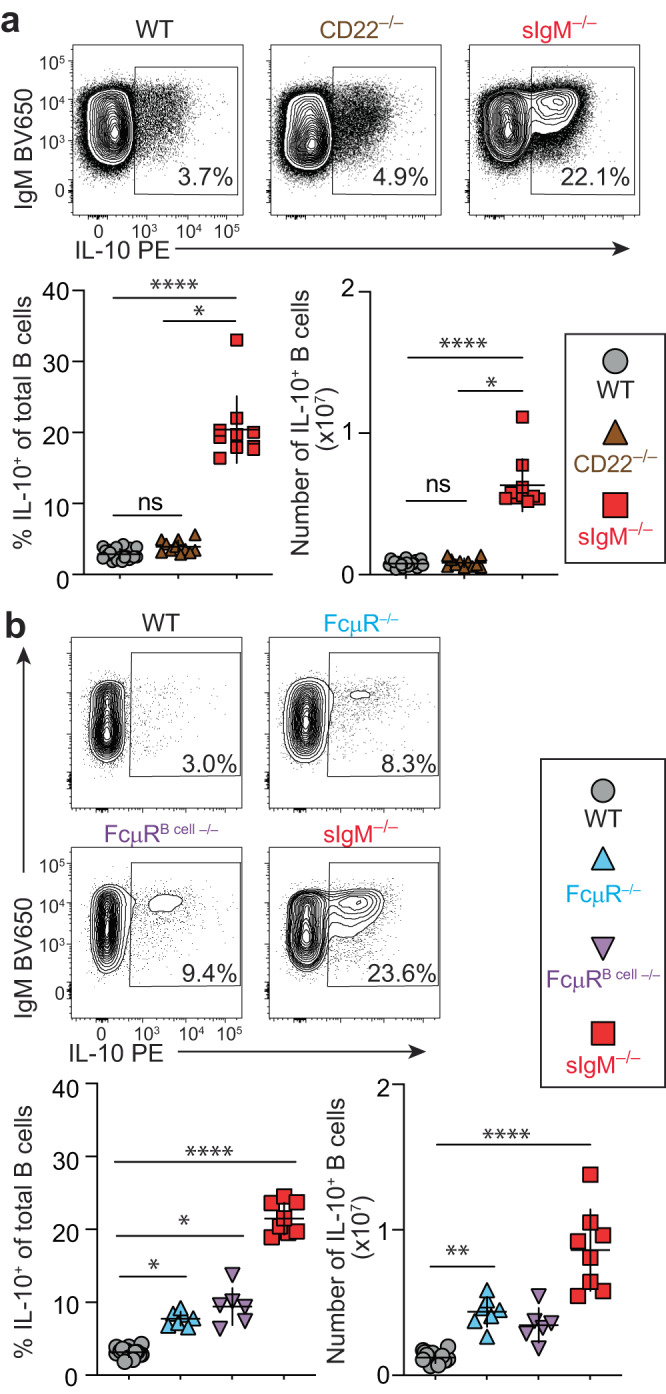
Fig. 5. Lack of FcμR partially phenocopies the IL-10+ B-cell phenotype of sIgM–/– mice.

a, b Flow cytometric analysis of IL-10 expression after 4-h stimulation with phorbol 12-myristate 13-acetate/ionomycin/lipopolysaccharide in splenic B cells. a WT (n = 21), CD22–/– (n = 11), and sIgM–/– (n = 10), WT vs. CD22–/– p = 0.0608, WT vs. sIgM–/– ****p < 0.0001, CD22–/– vs. sIgM–/– *p < 0.0263. b WT (n = 16), FcμR–/– (CmvcreFcmr–/–) (n = 7), FcμRB cell–/– (CD19cre Fcmrfl/fl) (n = 6), and sIgM–/– mice (n = 8) (WT vs. FcμR–/– *p = 0.0462, WT vs. FcμRB cell–/– *p = 0.0109, WT vs. sIgM–/– ****p < 0.0001, FcμR–/– vs. FcμRB cell–/– p > 0.99999, FcμR–/– vs. sIgM–/– p = 0.1994, FcμRB cell–/– vs. sIgM–/– p = 0.7847). Data points indicate mean ± SD, and each symbol represents one mouse. P values were calculated using Kruskal–Wallis test with Dunn’s multiple comparisons test; not significant (ns). Data are pooled from 2 independent experiments. Source data are provided with this paper.
