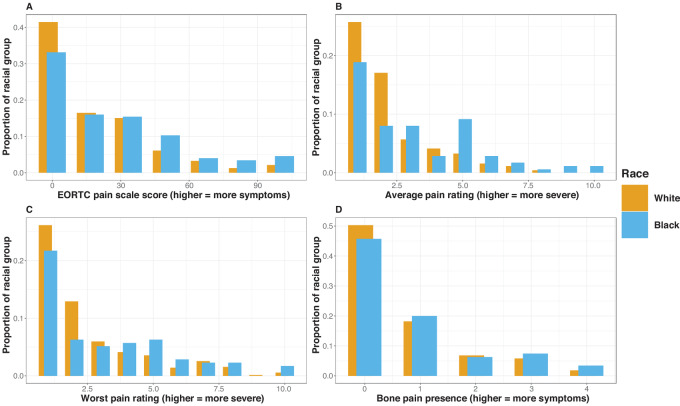
FIGURE 1.
Distributions of pain at study enrollment by race. A, Distributions of scores on the EORTC pain scale by race. B, Distributions of scores on the average pain scale by race. C, Distributions of scores on the worst pain scale by race. D, Distributions of scores on the bone pain scale by race.

