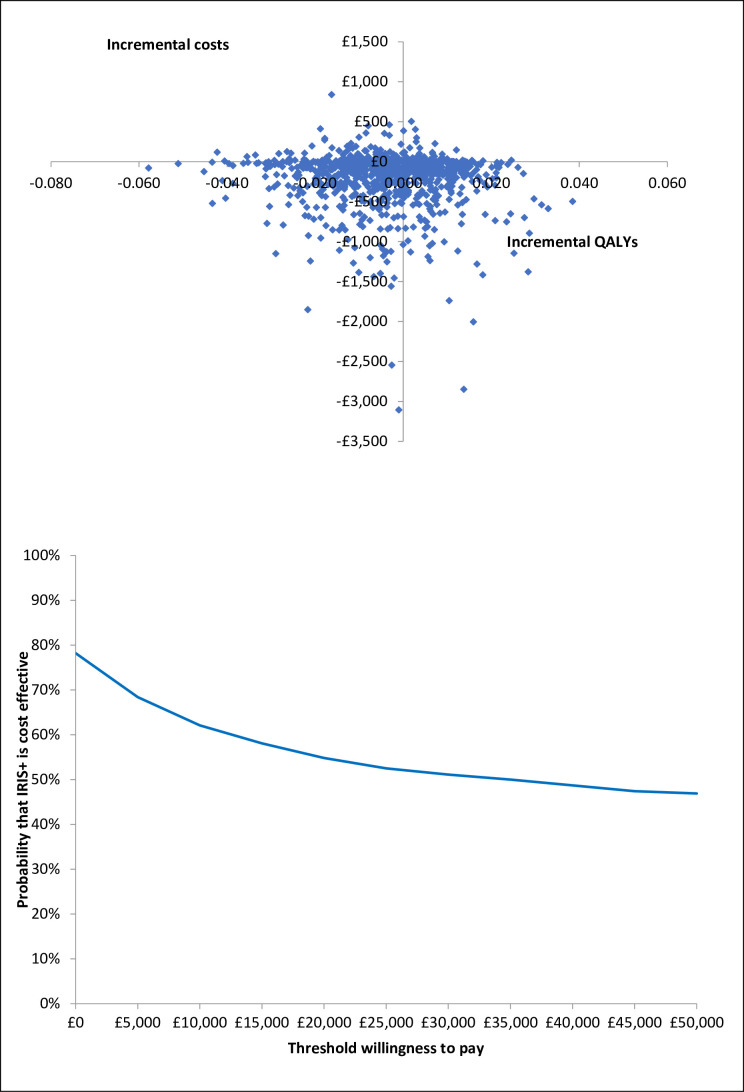
Figure 2.
Probabilistic sensitivity analysis. (A) Scatter plot of incremental costs and incremental QALYs from 1000 simulations. (B) Cost-effectiveness acceptability curve showing the probability that the intervention (IRIS+) is cost-effective versus control (IRIS) at different values of the maximum willingness to pay for a QALY. Costs are in 2019/2020 UK£. IRIS+, Identification and Referral to Improve Safety plus; QALY, quality-adjusted life year.

