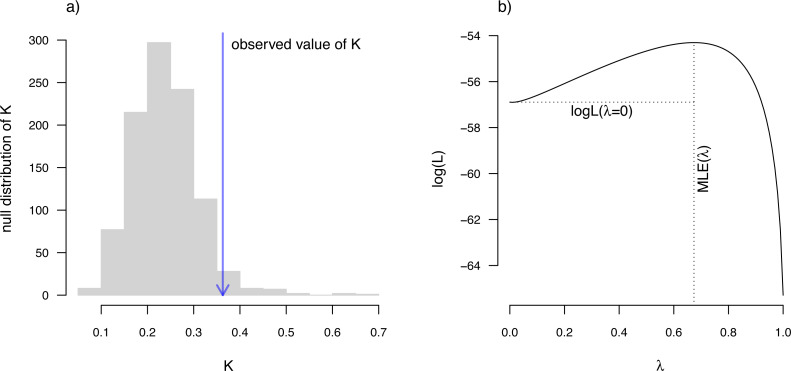
Figure 10. (A) Blomberg, Garland & Ives (2003) measured value of the K statistic for phylogenetic signal, compared to a null distribution of K obtained via randomization. (B) Pagel’s (1999) λ statistic for phylogenetic signal, also showing the likelihood surface. Data consist of maximum body length (on a log scale) from 61 species of elopomorph eels (Collar et al., 2014).
See main text for additional details.

