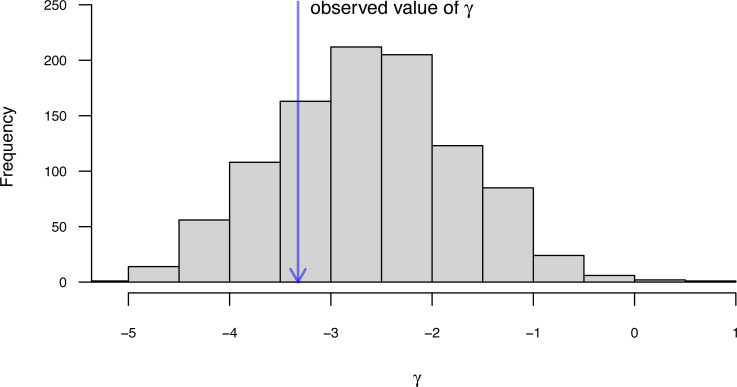
Figure 17. Distribution of simulated values of γ for the MCCR test, and observed value for the lineage through time curve of the phylogeny of elapid snakes given in Fig. 16.
Phylogenetic tree based on Lee et al. (2016). See main text for more details.

