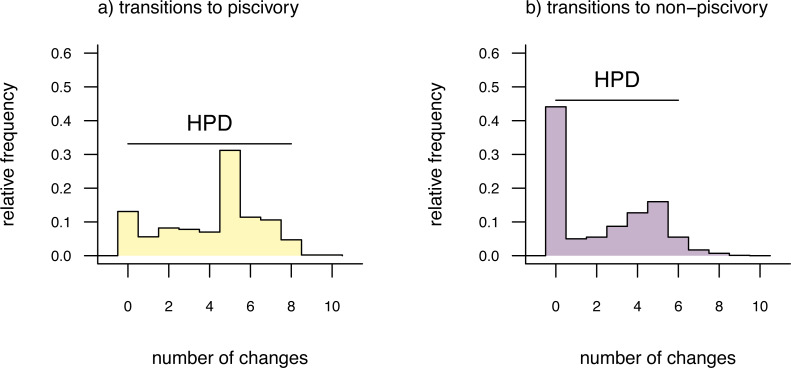
Figure 3. Posterior probability distributions of changes from either (A) non-piscivory to piscivory, or (B) piscivory to non-piscivory, obtained from an analysis of stochastic mapping.
HPD indicates the 95% high probability density interval for changes of each type. See main text for additional details.

