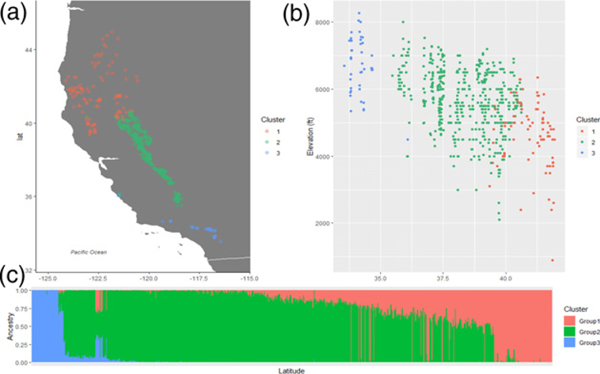
Figure 1.
Population structure based on fastSTRUCTURE results. (a) Geographic map showing genetic clusters in natural populations of sugar pine. (b) Genetic clusters along elevational gradients. (c) Barplot of ancestry levels per individual, as obtained by fastSTRUCTURE. Colors represent genetic clusters.

