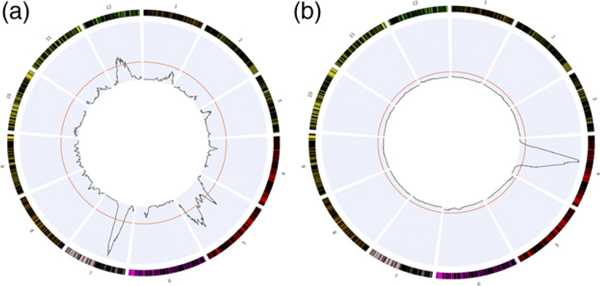
Figure 3.
Consensus linkage map for sugar pine showing 12 linkage groups and results of the QTL analysis. (a,b) LOD scores (black lines) for (a) backcross 1 and (b) backcross 2. The horizontal red line represents a 95% significance threshold for each test generated by randomly shuffling trait values relative to genetic information for 1000 permutations. The threshold is determined by the most extreme 5% of LOD scores generated by these permutations.

