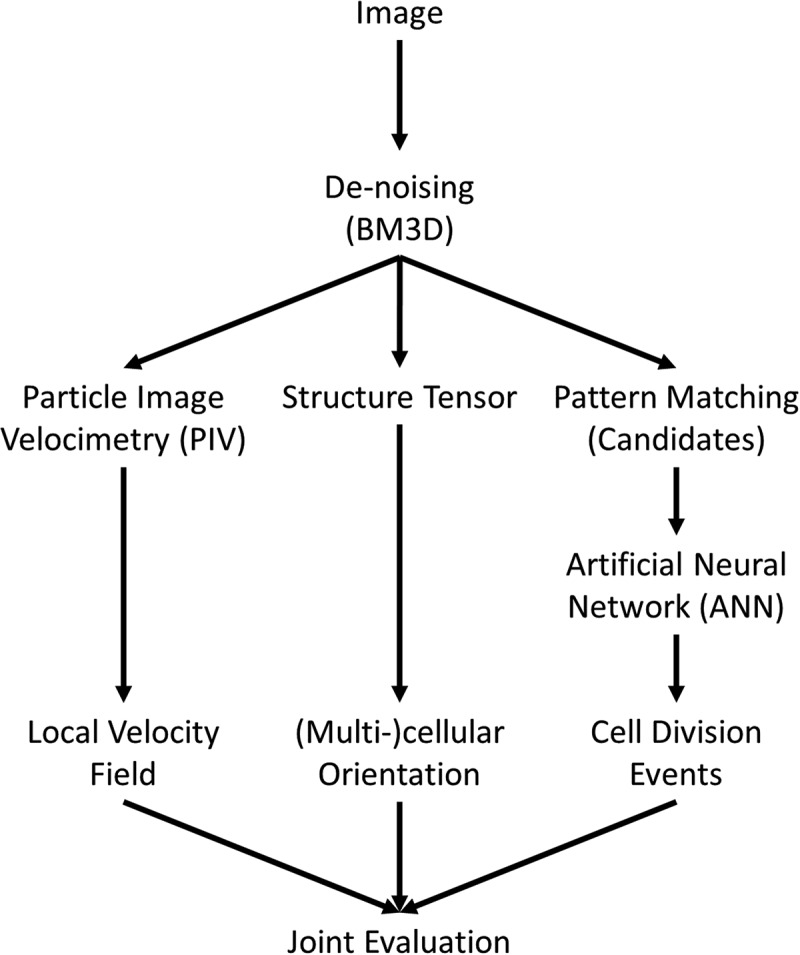
Figure 1.

Scheme of image analysis. At first an optional de-noising of the image is performed. Afterwards local velocity fields are calculated using particle image velocimetry, a cross-correlation based pattern matching approach. Using the eigenvectors of the structure tensor an orientation map of the cell layer is generated and lastly cell divisions are identified using a combination of pattern matching and artificial neural networks. The data of local velocity, orientation, cell division events and cell density can be used for a joint analysis of all parameters and their interdependencies.
