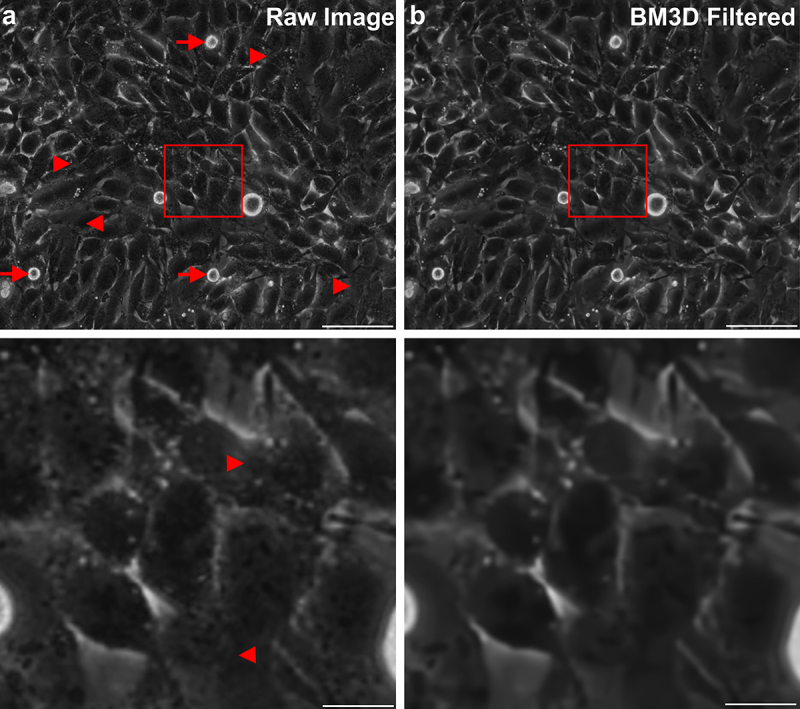
Figure 2.

Effects of de-noising. a) typical unfiltered image of a dense layer of U138 glioblastoma cells. Arrows point to cell division events and arrowheads to regions of unclear cell-cell boundaries. The bottom image corresponds to an enlarged version of the marked region of the full size image. b) De-noised version of the image shown in a) and the respective magnification. Please denote the reduction of small intracellular structures and conservation of edges. Scale bars depict 100 µm (top row) or 20 µm (bottom row).
