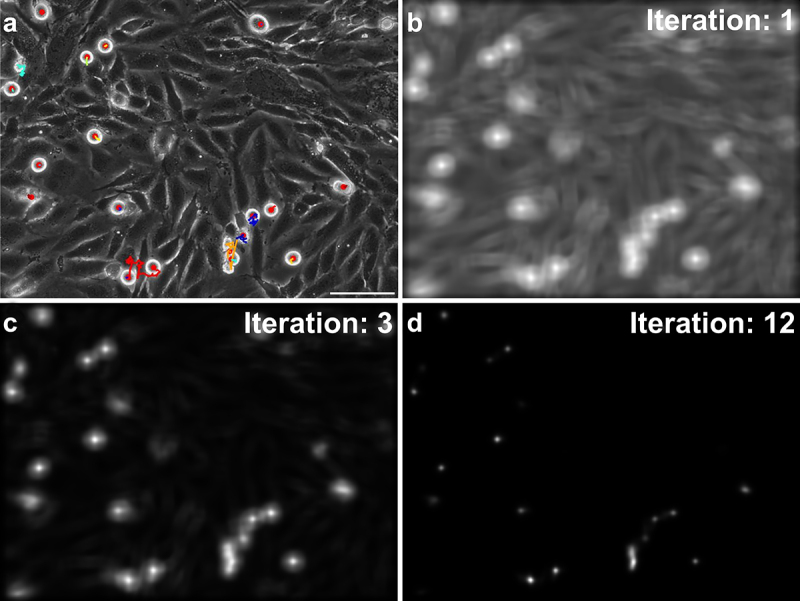
Figure 4.

Identification of cell division events. a) image of an U138 cell monolayer, with marked division events (red dots) and associated tracks (colored lines). b) cross correlation map used for the identification of candidates for cell divisions fed into the neural network, when using only one template for matching. c, d) evolution of the cross correlation map when using 3 or 12 templates for matching. Denote the improved signal-to-noise ratio and sharper localization of potential divisions. The scale bar depicts 100 µm.
