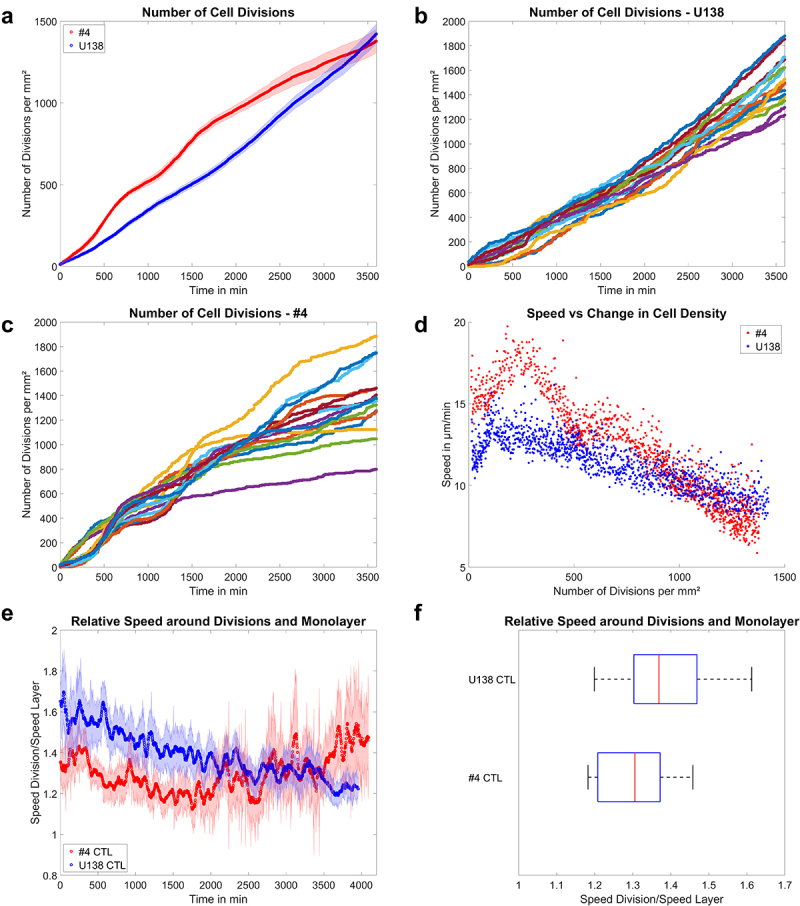
Figure 5.

Applications of the cell division detection a) mean number of cell divisions tracked over 60 h for U138 and GBM #4. Shaded areas depict the standard error of the mean. b, c) division events observed in individual fields of view for U138 and GBM #4. d) plot of the mean instantaneous layer speed as a function of the mean change in cell density for both GBM lines. e) mean ratio of the instantaneous speed of the monolayer around divisions to the rest of the layer as a function of time. Shaded areas depict the standard error of the mean. f) time averaged ratio of the speed of the monolayer around divisions to the rest of the layer. Box plots show the median (red line), 25 and 75%ile (box), non-outlier range (whiskers) and outliers (red dots). Line plots: mean ± SEM for n = 3 and a total of 15 fields of view.
