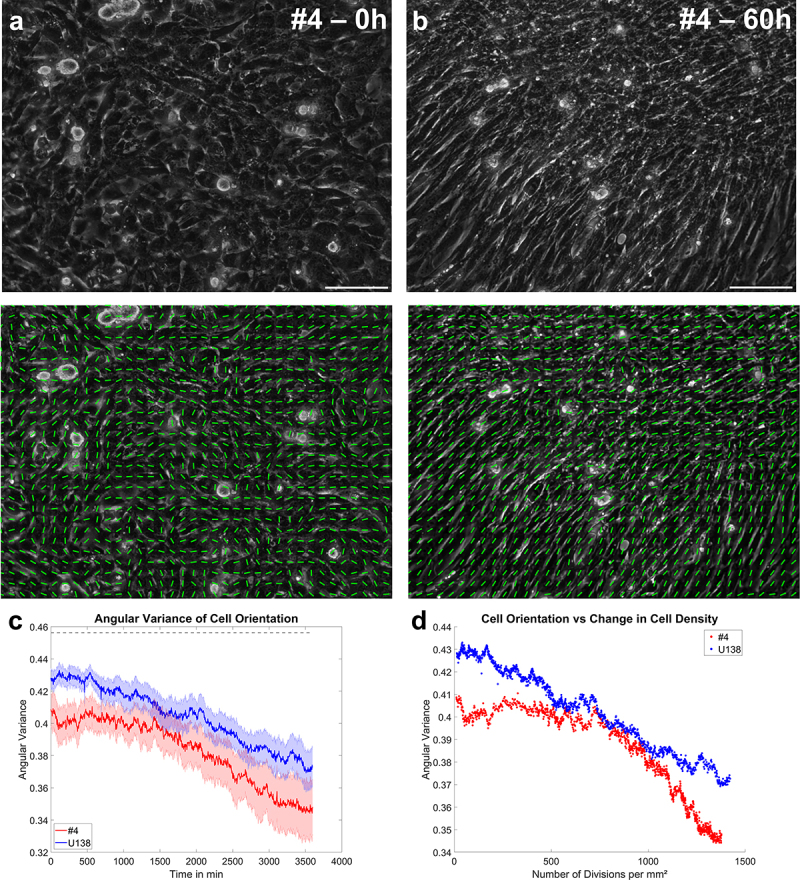
Figure 6.

Application of the orientation analysis. a, b) typical images of GBM #4 at the beginning and end of a measurement, together with the overlaid local cellular orientation. The scale bar depicts 100 µm. c) mean angular variation of the cell orientation as a function of time. The dotted line shows the expected value for a random distribution of angles from 0 to π/2. Error bars and shaded areas depict the standard error of the mean. d) scatter plot of the mean angular variation of cell orientation as a function the mean change in cell density. Line plots: mean ± SEM for n = 3 and a total of 15 fields of view.
