
Figure 7.
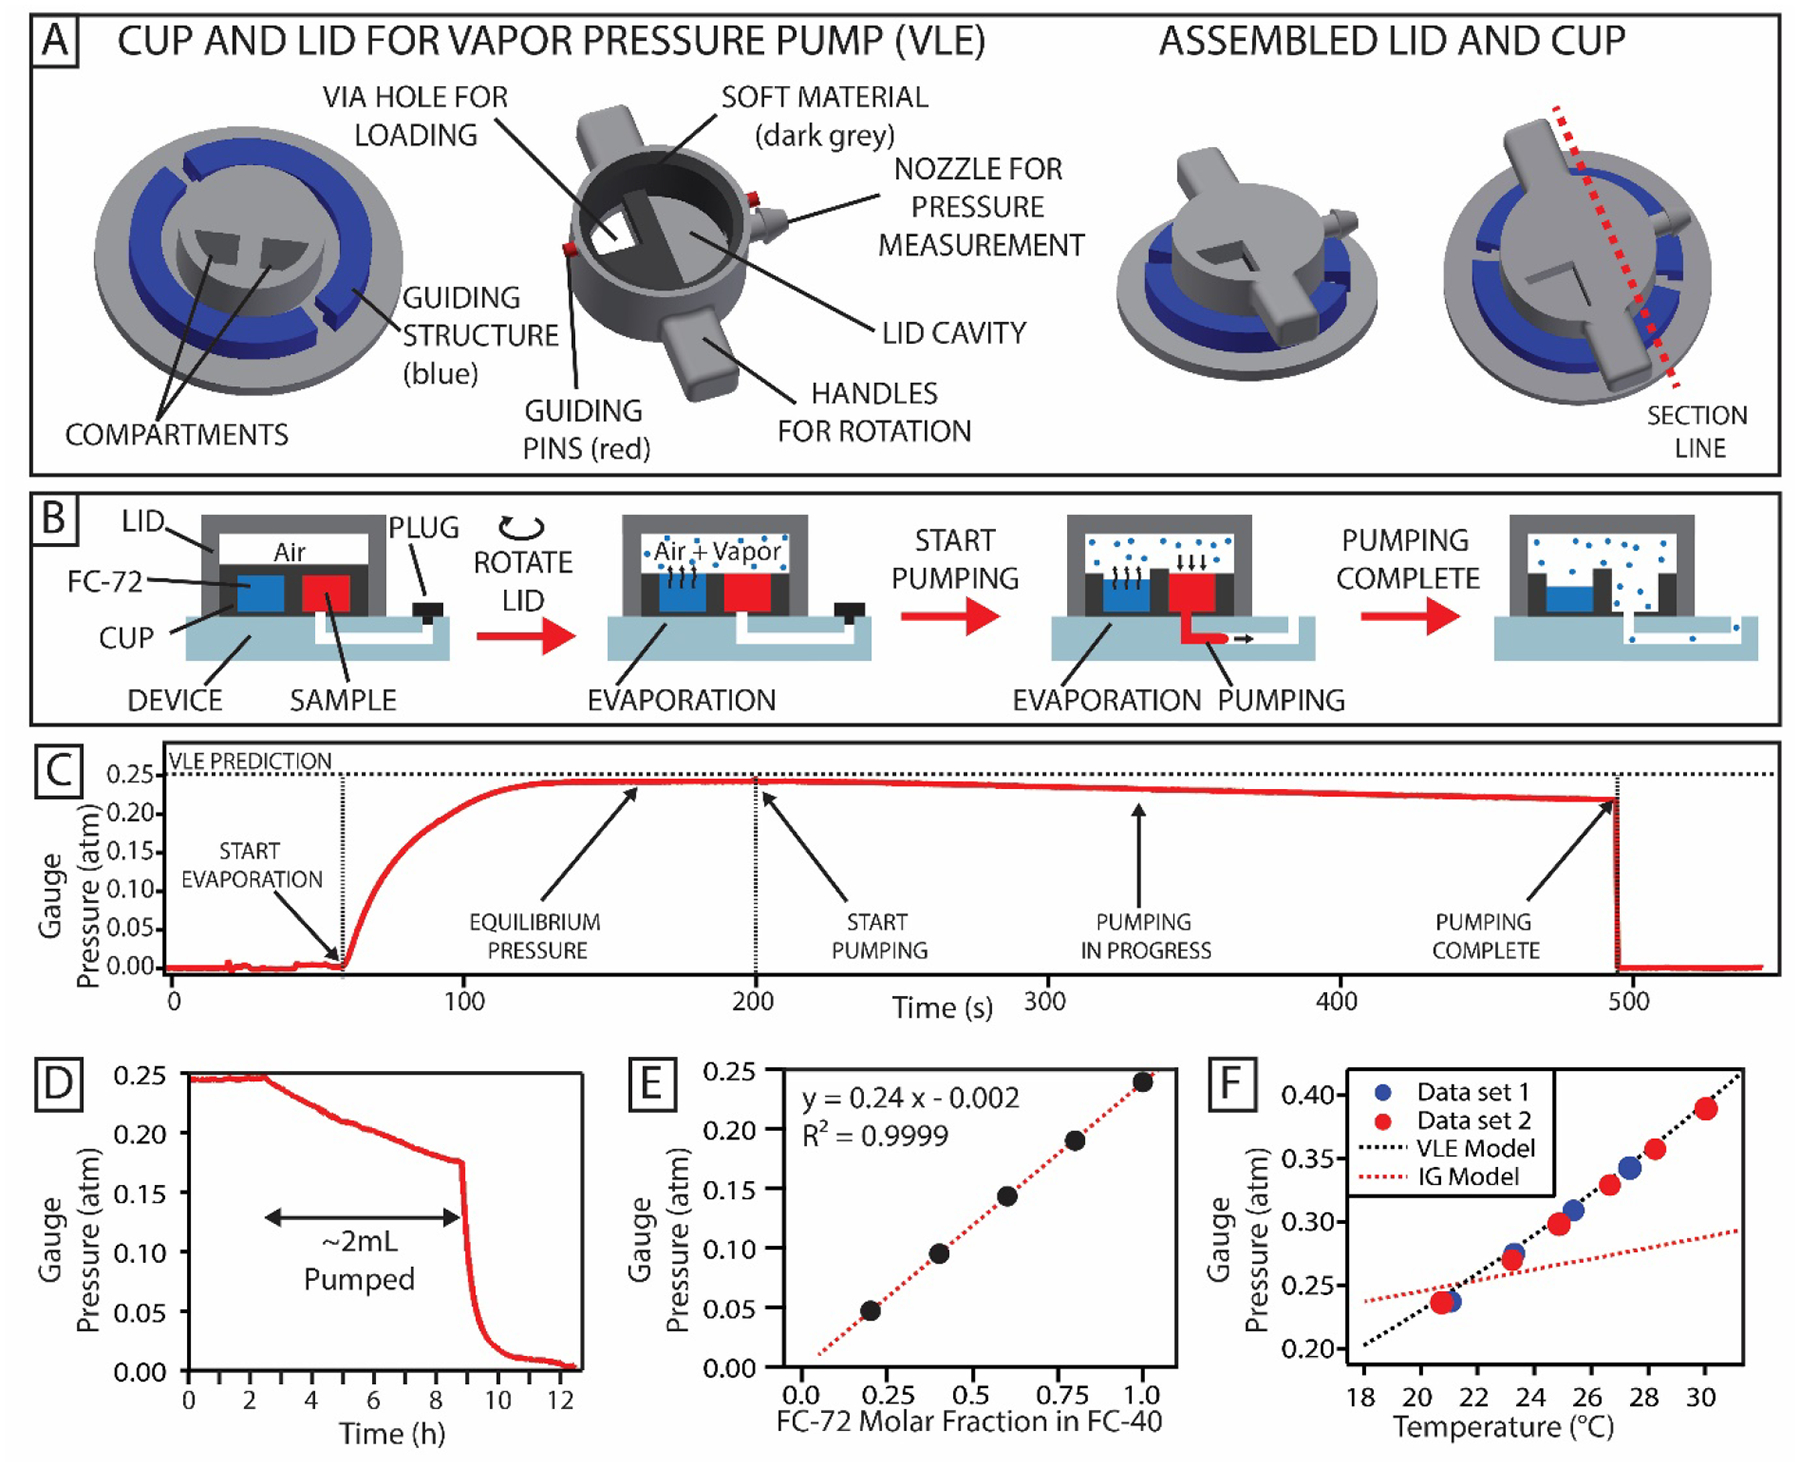
Generation of pressure using vapor liquid equilibrium (VLE). (A) Schematics of the parts used for VLE pressure generation. (B) Schematics of the method used to generate pressure. The figures show the cross section of the lid and cup assembly along the red line shown in panel A. Prior to the experiment, a volatile liquid (FC-72, blue) and the sample (red) are placed in isolated compartments of the cup. At this stage, the pressure in the lid cavity is equilibrated with the atmosphere. When the lid is rotated, the volatile liquid is exposed to the air in the cavity and starts to evaporate to reach its equilibrium pressure. When the plug is removed from the device outlet, the sample starts flowing. After the entire sample has been pumped, the cavity is in contact with the external atmosphere and the pressure returns to zero. (C) An experimental pressure profile obtained by performing the steps described in panel B, for pumping 20 μL of water. (D) Pressure profile obtained when pumping a 2 mL sample volume through a microfluidic device. (E) Equilibrium pressures obtained by using mixtures of liquids (FC-72 and FC-40) at different molar fractions (N=3; error bars smaller than the size of the marker). The dashed line indicates the linear fit of the data and its parameters are reported in the graph. (F) Equilibrium pressure obtained using FC-72 at different temperatures. The dashed line shows the values predicted by the VLE model (Eq. 16). Each point represents the average over at least 62 and up to 87811 pressure measurements after the system has equilibrated.