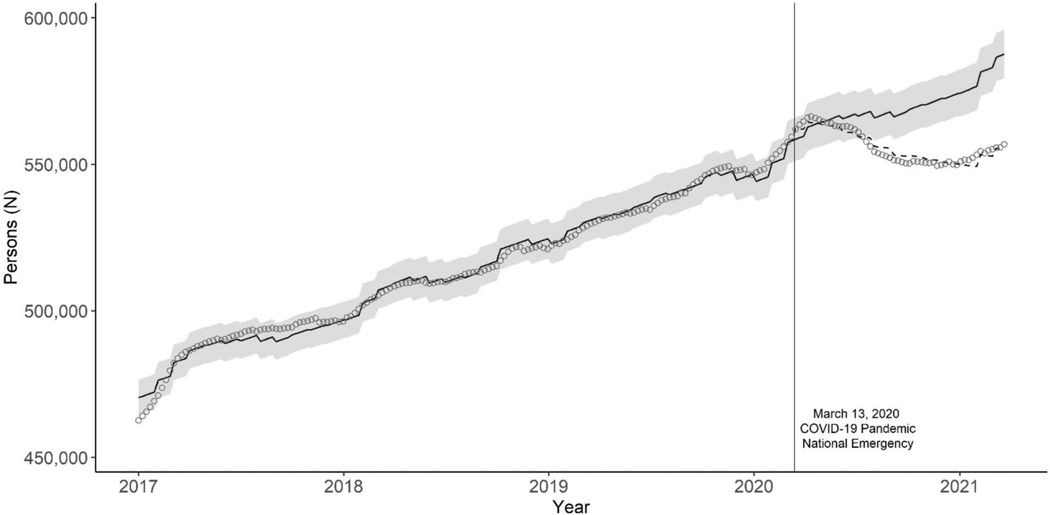
Fig. 1. Observed and predicted weekly number of persons with active antiretroviral prescriptions for HIV treatment in the United States, January 2017–March 2021.
Circles: circles represent observed weekly number of persons. Dashed line: Predicted number of persons based on antiretroviral use from 2017 to March 2020. Blue solid line and band: Predicted number of persons and 95% confidence interval assuming absence of COVID-19 pandemic. During a given year, a person with an active antiretroviral prescription during the year might not have had an active prescription every week, resulting in a total number of persons with any antiretroviral prescription during the year (Table 1) being greater than the number of persons with an active antiretroviral prescription each week. ART, antiretroviral therapy; COVID-19, coronavirus disease 2019.

