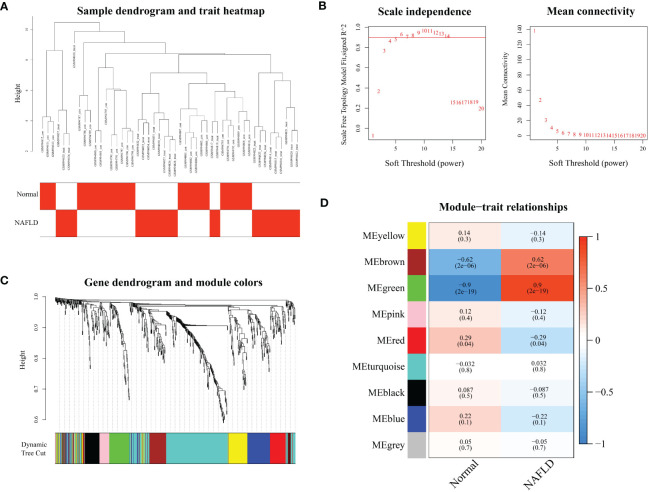
Figure 1.
Modular analysis of weighted gene co-expression network analysis. (A) Sample clustering dendrogram for each sample corresponding to the leaves of the tree is cut at 10.5. (B) Analysis of the scale-free index and the mean connectivity for various soft-threshold powers. (C) Displays the merged modules under the cluster tree. (D) The correlations and corresponding p-values of each cell are presented about Module-trait correlations.

