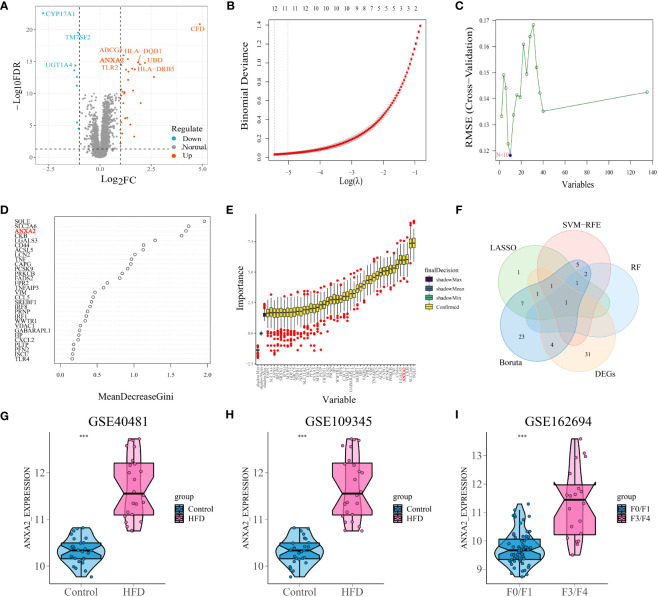
Figure 2.
Differential analysis and selection of candidate characteristic biomarkers in module genes based on machine learning algorithms. (A) Volcano plots displayed the differentially expressed gene with the criteria of |logFC| > 1 and p-value< 0.05. The red and green circles indicate the up-regulated and down-regulated DEGs, respectively. (B) By conducting cross-validation to select the optimal tuning parameter log (Lambda) in LASSO regression analysis, 12 genes were ultimately obtained. (C) 10 genes obtained using the SVM algorithm. (D) The top 4 genes with MeanDecreaseGini > 1.5 were selected. The rank of genes is shown according to their relative importance. (E) With importance ranking, 37 selected typical genes by Boruta. (F) Venn diagram shows that the candidate characteristic gene ANXA2 is identified via the above 4 machine learning algorithms and differential analysis. (G, H) The expression of ANXA2 in GSE40481 and GSE109345, respectively. “***” means that p < 0.001. (I) Differential expression of ANXA2 in mild versus severe fibrosis. “***” means that p < 0.001.

