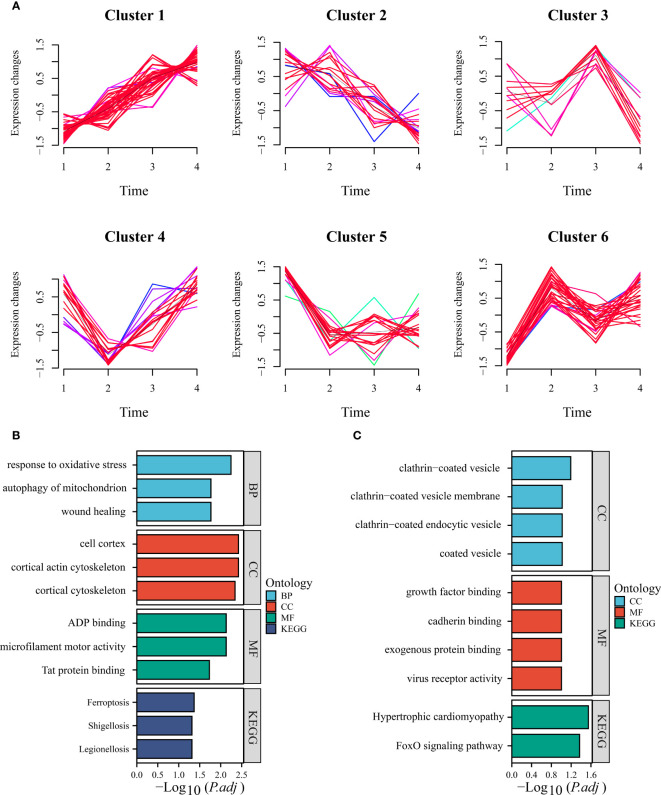
Figure 3.
Time series analysis of module genes. (A) Time-based analysis facilitated the derivation of six clusters (clusters 1, 2, 3, 4, 5, and 6). (B) The bar chart presented herein showcases the up-regulation of GO and KEGG terms characteristic of cluster 6. (C) Conversely, the bar chart provided depicts the consistency of down-regulated GO and KEGG terms exhibited by cluster 3.

