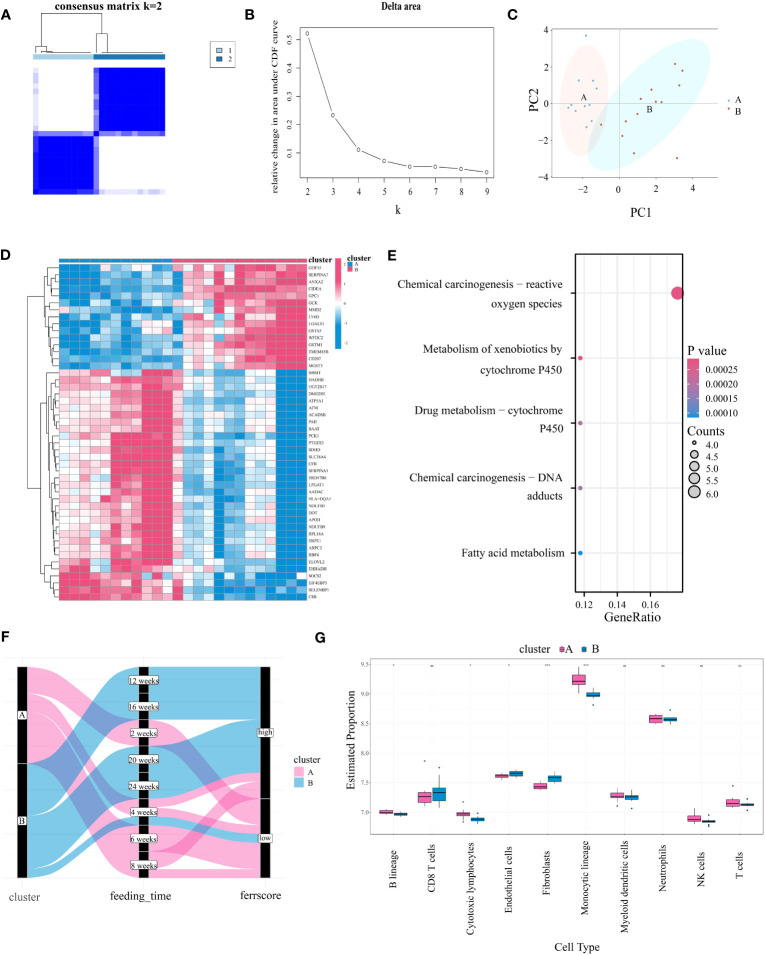
Figure 4.
Identifying Ferroptosis Subgroups Through Unsupervised Consensus Clustering Algorithms. (A) Two ferroptosis subgroups were ascertained the optimal value for consensus clustering. (B) The corresponding relative area changes under the cumulative distribution function (CDF) curve. k takes values ranging from 2 to 9, with the optimal k = 2. (C) The PCA plot shows two divided ferroptosis subclusters. (D) The heatmap showing differential gene expression between the two ferroptosis isoforms. (E) KEGG analysis of differentially expressed gene in two subgroups. (F) Sankey diagram between ferroptosis isoforms, high-fat diet feeding time and ferroptosis score (with cutoff value at 0, greater than zero for high score and less than zero for low score). (G) Differences in immune cell expression between ferroptosis subgroups by MCPcounter. "*” means that p < 0.05; “**” means that p < 0.01; “***” means that p < 0.001; ns, no significance.

