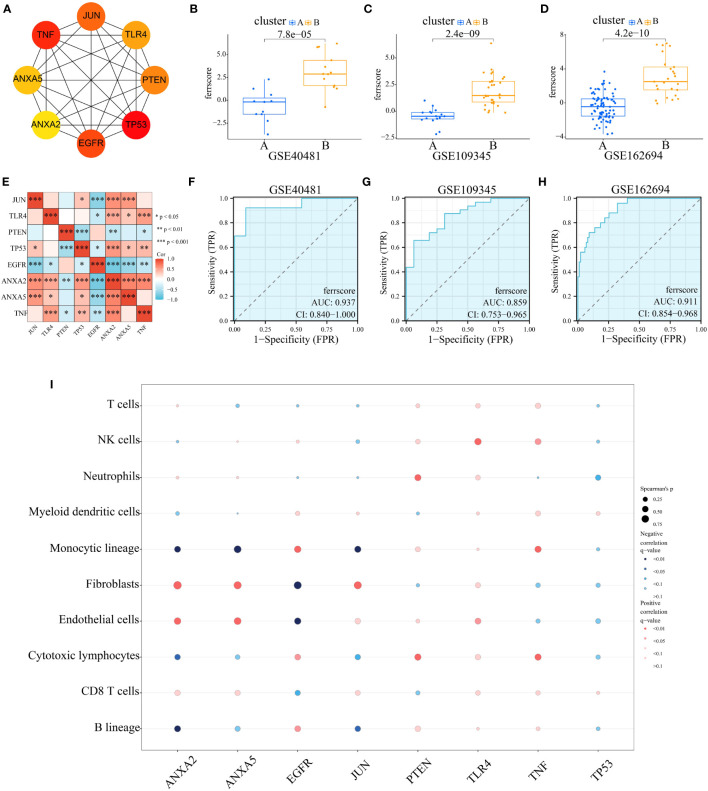
Figure 5.
Construction and Validation of Ferroptosis Score. (A) Using Cytoscape and CytoHubba to identify 8 modular genes to construct ferroptosis score and visualize molecular interaction networks. (B–D) Differences in ferroptosis score between two ferroptosis subgroups in GSE40481, GSE109345 and GSE162694. (E) Correlation between ferroptosis score genes. (F–H) The receiver operating characteristic (ROC) curve for differentiating ferroptosis subgroups by ferroptosis score in GSE40481 (AUC=0.937), GSE109345 (AUC=0.859) and GSE162694 (AUC=0.911). (I) Bubble diagram of the relationship between 8 score genes and immune cells.

