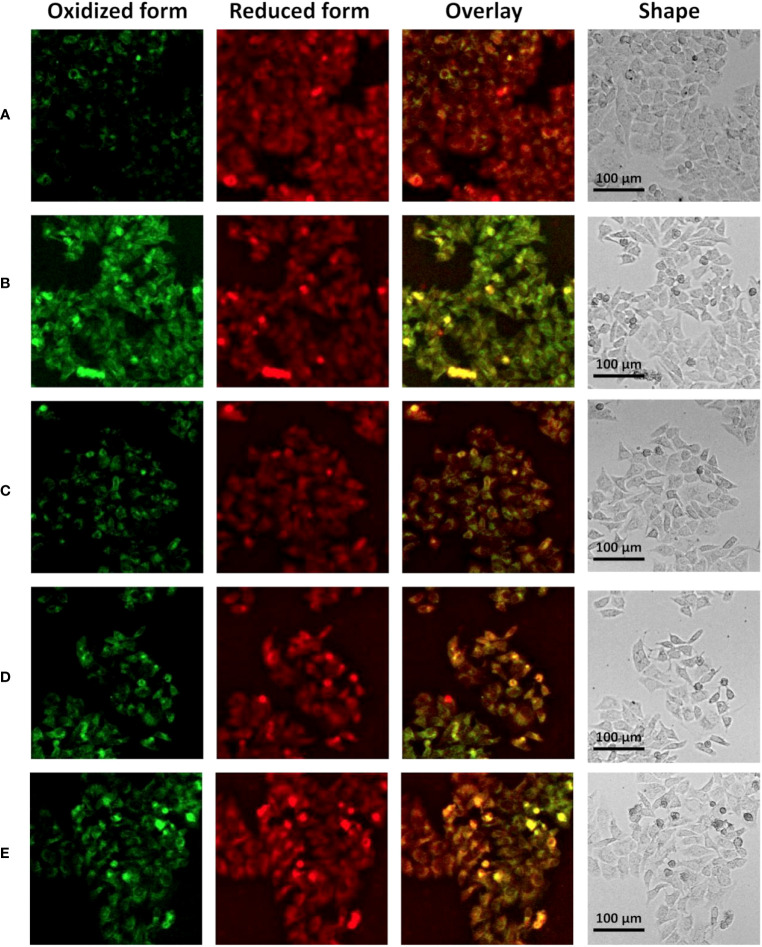
Figure 7.
The effect of ANXA2 on lipid peroxidation in cells. (A) Normal control HepG2 cells; (B) HepG2 cells co-cultured with siRNA control for 48 h and then treated erastin (20 μM) for 24 h; (C) HepG2 cells co-cultured with siANXA2-1 control for 48 h and then treated erastin (20 μM) for 24 h; (D) HepG2 cells co-cultured with siANXA2-2 control for 48 h and then treated erastin (20 μM) for 24 h; (E) HepG2 cells treated erastin (20 μM) and Ferrostatin-1 (2 μM) for 24 h. (The scale bar indicates 100 μm length, cells were incubated with C11 BODIPY 581/591 for 60 min to label lipid peroxide, the FITC channel (green color) indicates oxidized form while the Cy5 channel (red color) indicates the reduced form).

