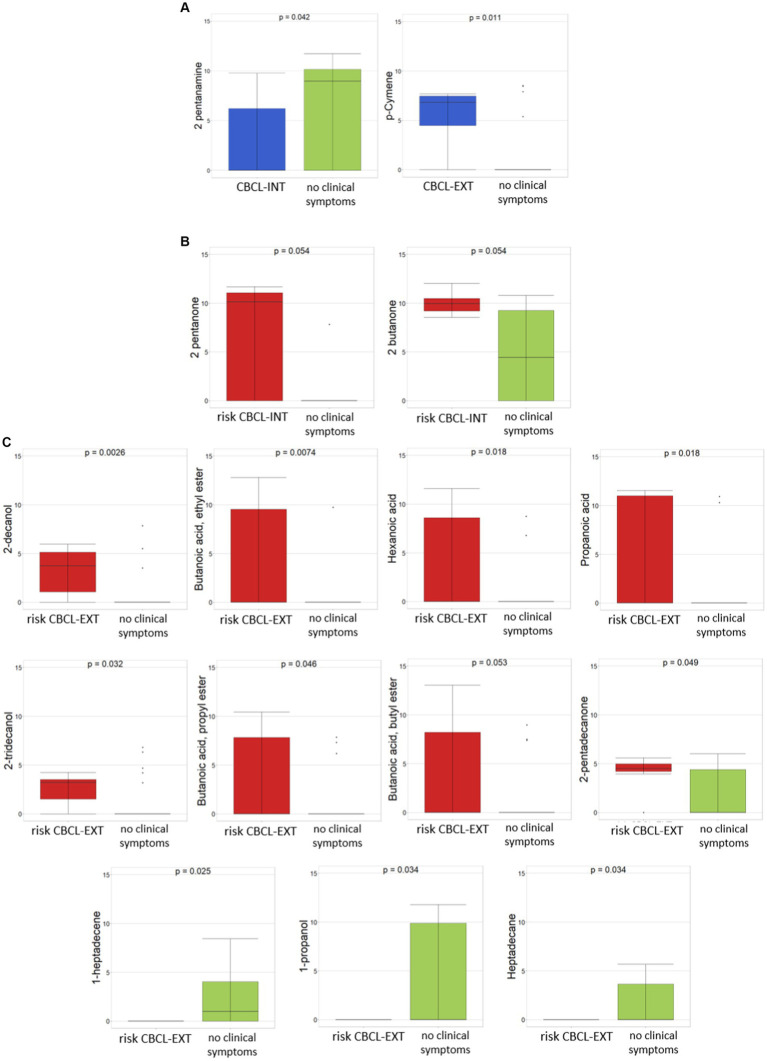
Figure 4.
Differential abundances of VOCs between ASDs with clinical symptoms and ASD with risk of clinical symptoms, reported as CBCL-based score, vs ASD with no clinical symptoms. (A) CBCL-INT and CBCL-EXT, both related to ASDs with presence of clinical symptoms vs ASDs with no clinical symptoms. (B) CBCL-INT risk subgroup vs ASDs with no clinical symptoms. (C) CBCL-EXT risk subgroup vs ASDs with no clinical symptoms. Colors: (A) Blue, CBCL-INT and CBCL-EXT including ASDs with clinical symptoms; green, ASDs with no clinical symptoms; (B) and (C) red, CBCL-INT and CBCL-EXT including with ASDs with risk of clinical symptoms; green, ASDs with no clinical symptoms. p ≤ 0.05 based on Mann–Whitney test.

