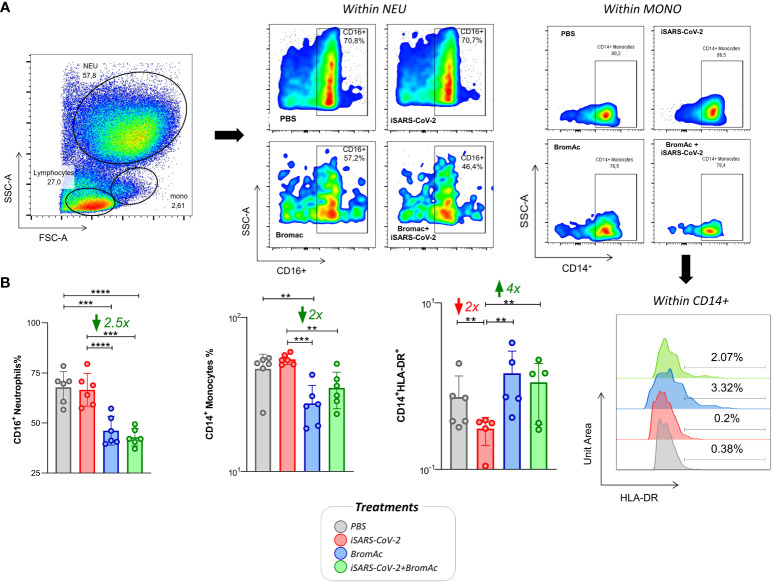
Figure 4.
Immunophenotypic characterization and visualization of neutrophil and monocyte subpopulations after iSARS-CoV-2 short-term stimulation and upon BromAc® treatment. (A) Size (FSC) vs complexity (SSC) dot plots of a representative healthy donor followed by the CD16 and CD14 marker expression for the different treatments; (B) the immunomodulatory profile of BromAc® on neutrophils and monocytes stimulated with iSARS-CoV-2 in an in vitro system employing peripheral blood cells obtained from heparinized blood collected from six healthy volunteers. The legend shows the different treatments performed and their respective color key. The results are expressed in % and presented as scattering distribution of individual values over bar plots, underscoring the median value on each bar. Significant differences at p<0.005 (**), p<0.0005 (***) and p<0.0001 (****) are indicated by asterisk and connecting lines to the iSARS-CoV-2 culture with the PBS, BromAc, and BromAc® + iSARS-CoV-2 cultures. The red and green arrows indicate the fold-change increase induced by the stimuli and the reductions associated with the treatment, respectively.

