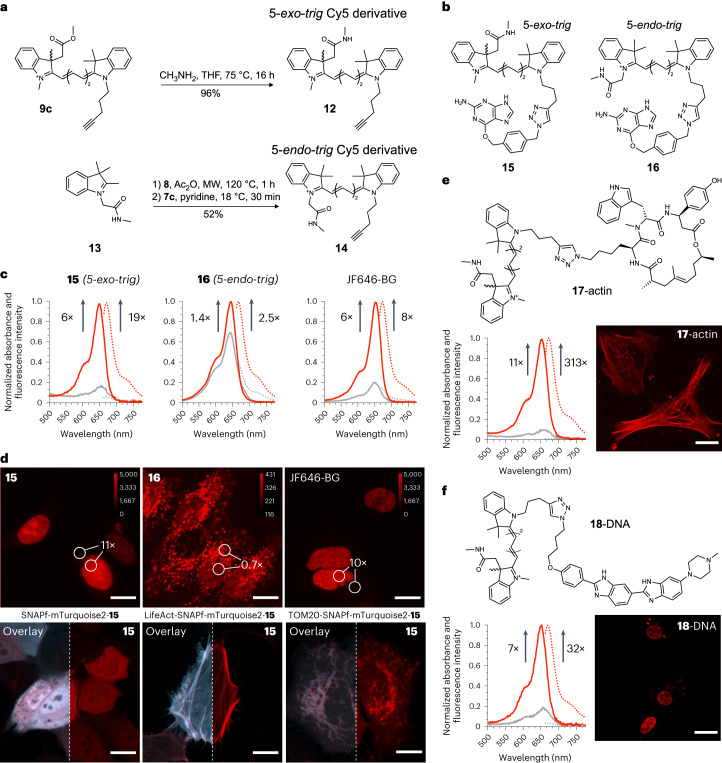
Fig. 3. Synthesis, in vitro evaluation and live-cell validation of fluorogenic Cy5 derivatives.
a, Synthesis of 5-exo-trig and 5-endo-trig Cy5 derivatives with an N-methyl amide as a ring-closing moiety. b, Structures of compounds 15 and 16 functionalized with benzyl guanine for SNAP-tag labelling. c, Protein-binding turn-on of 15, 16 or JF646-BG with SNAP-tag protein. For protein-binding studies, probes (2.5 µM) were incubated with 5 µM purified SNAP-tag protein in PBS for 1.5 h at pH 7.4. d, No-wash, live-cell imaging of HeLa cells that were transfected with H2B-SNAPf-mTurquoise2 (upper images) or with the indicated plasmid (lower images) and incubated with 15 (50 nM), 16 (50 nM) or JF646-BG (50 nM) as indicated. The calibration bars indicate raw pixel values. e, Structure, protein-binding turn-on and no-wash live-cell imaging in HeLa cells of 17-actin. The concentration of 17-actin was 2.5 µM for protein-binding studies and 250 nM for cell imaging. f, Structure, DNA-binding turn-on and live-cell imaging in HeLa cells of 18-DNA. The concentration of 18-DNA was 1 µM for DNA-binding studies and 500 nM for cell imaging. Scale bars, 15 µm. Spectra are the mean from three independent experiments and the lines indicate absorbance (solid) or fluorescence (dotted) of the free dye in solution (grey) or the dye–macromolecule conjugate. Micrographs are representative of three independent biological samples measured over three separate imaging sessions.

